
Convergence Commentary - November 2025
Quick Hits
Market-Moving Highlights
The government shutdown that began October 1 extended to a record length before finally coming to an end on November 13. Generally speaking, government shutdowns have had a muted effect on financial markets, and in some ways, this time was no different: the S&P 500 actually rose about 2.5% over the shutdown period.
The intermediate impacts, however, are still being felt. That’s because the shutdown has delayed a slate of key economic data, data that Federal Reserve officials desperately need to inform policy decisions.
The Fed is set to meet again on December 9th-10th to determine the appropriate level of interest rates. They’re tasked with a dual mandate from Congress - to promote maximum employment and maintain price stability. Yet since cutting rates by 0.25% in mid-September, officials have seen just one CPI report (which showed year-over-year inflation rising to its highest level in more than a year) and one payrolls report from the BLS (a delayed September number).
The long-awaited September jobs report sent rather mixed messages. One hundred nineteen thousand nonfarm payrolls were added during the month, well above consensus expectations and the most since April. At the same time, the unemployment rate rose to 4.4%. That’s the highest since 2021.
In deciding what to do with rates, Fed officials must balance those two conflicting data points along with uncertainty around elevated inflation. And their job is made even more difficult by the shutdown’s impact on data collection: the BLS canceled the October payrolls and CPI reports entirely, and November data likely won’t be released until after the FOMC meets next week.
Index Performance
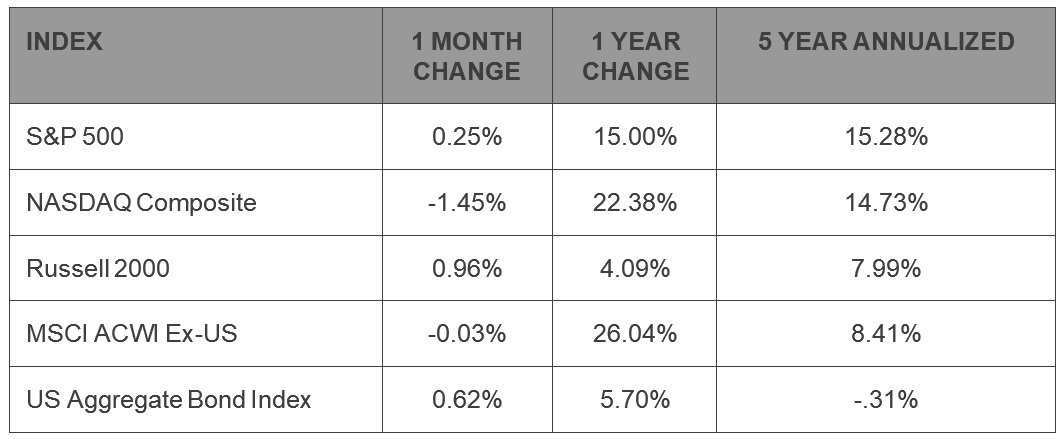
A stock market selloff in the middle of November was largely erased over the final week-and-a-half of trading. The S&P 500 index rose 0.25% for the month, good enough for the highest ever monthly close. The growth-oriented NASDAQ Composite took the brunt of the selling pressure and wasn’t able to fully recoup losses. The Russell 2000 index of small caps, however, surged more than 8% from its November 20 lows to end the month 1% higher. Outside of the US, stock prices were virtually unchanged for the month. Over the last year, however, the MSCI ACWI ex-US Index has outperformed its domestic counterparts.
The US Aggregate Bond Index rose, aided by a 10-year US Treasury yield that fell for the fourth consecutive month.
S&P 500 Sector Highlights
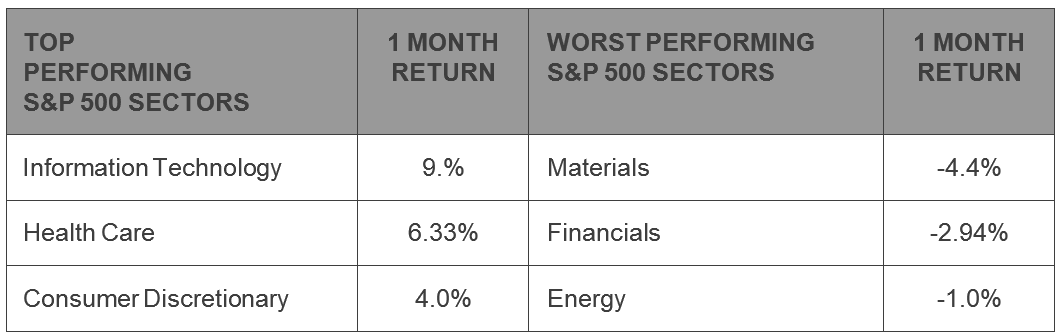
Health Care stocks have staged a miraculous recovery over the past few months. In August, the S&P 500 Health Care sector was hitting 20-year lows when compared to the overall S&P 500 index. Since then, the sector has outperformed the benchmark by 13%, thanks in large part to a 9% gain in November. The Materials sector also rebounded in November after lagging for much of the first 10 months of the year. Both Health Care and Materials are now in the middle of the pack on a year-to-date basis. Communication Services, however, is at the top of the 2025 leaderboard. That sector rose another 6% in November and has gained more than 30% this year.
On the downside, a selloff in AI-hardware stocks drove the Information Technology sector down more than 4%. Consumer Discretionary, home to two more mega cap growth stocks, dropped 2.4%, while Industrials, the sector whose returns are most closely correlated with the market as a whole, dropped 1%.
What to Watch in December
The government shutdown delayed a long list of economic data. Below, we highlight the reports we’re watching most closely this month.
12/3 – ADP Employment Change – November
We usually don’t pay much attention to this jobs report. The ADP estimates don’t always correlate with the BLS numbers, and the more comprehensive measure usually gets published just a few days after the ADP release. Since the usual monthly jobs report has been delayed until the 16th, however, we’ll take whatever data we can get our hands on. The Fed will likely be looking at this and other private measures of the labor market to help inform their upcoming interest rate decision.
12/5 - PCE Deflator – September
The Fed’s preferred measure of inflation is the PCE deflator. It typically gets less coverage than the more timely CPI report, but again, the government shutdown has shifted attentions. Though this report will be for the month of September, it’s one of the few data points the Fed has to work with before their meeting.
12/9 – JOLTS Job Openings - October
Another report that’s typically considered ‘second-tier’ in terms of importance, this report on the labor market will be released during the first day of the FOMC meeting. Job openings have dropped steadily over the past few years, and over the summer, dropped below the level of unemployed workers for the first time since 2021.
12/10 – FOMC Rate Decision
The Federal Reserve meets again to decide the appropriate level of interest rates. In September, the Fed lowered rates by 0.25% and left the December decision open-ended. Futures markets, however, are pricing in another 0.25% cut with near certainty.
12/16 – BLS Jobs Report – November
Better late than never. This jobs report would have been released on December 5, but data collection was delayed by the government shutdown. Since the October report was entirely canceled, this release will be the first comprehensive look at the labor market since the September release.
12/18 – Consumer Price Inflation - November
Year-over-year CPI rose to its highest level in more than a year in September, complicating the path for a Fed that must balance a weakening labor market with reaccelerating prices. The October CPI report was canceled in light of the shutdown, so this report will face close scrutiny after the delay.
12/23 – Q3 GDP
Both Q1 and Q2 were skewed by importers working to front-run tariff implementation by stockpiling inventories last winter. This estimate of Q3 GDP will give a cleaner look at how the US economy is actually performing.
Market Wrap
The S&P 500 Information Technology sector fell 4.4% in November, the worst monthly performance since March. Unlike the spring selloff, when traders were digesting the impacts of a new administration and tariff policy, there was no clear catalyst for November’s weakness. It may have been because of a government shutdown that reached a record length, disrupting thousands of workers and delaying key economic data. Or perhaps it was that investors have finally grown concerned about lofty valuations for US mega cap growth stocks. Many media pundits chose the latter as their preferred narrative: the AI-bubble is deflating.
We won’t be so bold as to predict a looming market crash, nor will we brush off potentially valid concerns about elevated market prices. Historians will prove much better at those predictions than anyone living in the moment. But we will seek to provide some context around all this ‘bubble talk’.
Concerns about market concentration and elevated valuations are nothing new - US equity returns have been dominated by a handful of stocks known as the ‘Magnificent 7’ for several years. These mega caps have skewed returns so that the vast majority of individual stocks have lagged the index over the past 3 years. Narrow market leadership has naturally drawn parallels to the dotcom era of the late 1990s.
One key difference between then and now, however, is that the price gains are being driven by actual earnings. In the late ‘90s, stocks were surging primarily on expectations for future income growth. The ‘expectations’ component of a stock price is more commonly referred to as ‘valuation’. Let’s put some numbers around the difference. In 1999, the top 10 largest companies in the S&P 500 traded at more than 40x forward earnings. Today, they trade at only about 30x. That’s still expensive (the long-term average multiple for the S&P 500 is somewhere around 17x), but far less expensive than in 1999. And for the Mag 7, valuations today aren’t materially higher than they’ve been for much of the last 5 years:
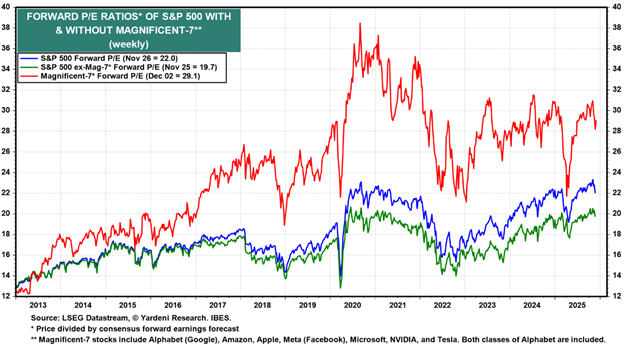
How’s that possible, given the staggering rise in stock prices over that period? Because revenues and earnings have grown at an equally staggering pace.
So when it comes to bubble talk, the big question is not really whether stocks are too expensive. It’s whether mega cap growth companies can maintain their record levels of earnings.
Stay tuned.
The opinions voiced in this material are for general information only and are not intended to provide specific advice or recommendations for any individual. All performance referenced is historical and is no guarantee of future results. All indices are unmanaged and may not be invested into directly.
Bureau of Economic Analysis: https://www.bea.gov/data/gdp/gross-domestic-product
Bureau of Labor Statistics: https://www.bls.gov/
US Census Bureau: https://www.census.gov/retail/sales.html
Federal Reserve: https://www.federalreserve.gov/
New York Federal Reserve: https://www.newyorkfed.org/microeconomics/hhdc
Market performance data sourced from Bloomberg Finance L.P. and Optuma