
Convergence Commentary - December 2025
Quick Hits
Fed: -0.25% rate cut, split views, 2026 may shift policy
Markets: Mixed in Dec; 2025 strong for US & international stocks
Jan Watch: Jobs, CPI, Retail Sales, Q3 GDP, Fed decision
Market-Moving Highlights
The Federal Reserve cut interest rates by 0.25% for the third consecutive meeting last month. The decision itself was telegraphed well in advance by Jerome Powell and many of his colleagues. That doesn’t mean everyone at the Fed agreed with the move, though. Three FOMC voters dissented from the quarter point cut. Stephen Miran, a recent and likely temporary appointee of the Trump administration, wanted a 0.5% move. On the other side of the spectrum, Kansas City Fed President Jeffrey Schmid and Chicago Fed President Austan Goolsbee dissented in favor of holding rates unchanged.
The opinion of Schmid and Goolsbee was shared by several more regional Fed presidents.
The Federal Open Market Committee is comprised of 19 voters: 7 Governors (each of whom vote at every Fed meeting) and 12 regional presidents (who get 5 votes on a rotating basis). Usually, there’s so much consensus that the voting rotation doesn’t matter. But the Summary of Economic Projections (SEP) made it clear that ‘groupthink’ isn’t a problem at today’s Fed.
The SEP, which details each FOMC member’s view of the appropriate federal funds rate over each of the next four calendar years, implied that six members - not just the two public dissents - believed holdings rates unchanged would have been more appropriate than cutting.
Index Performance
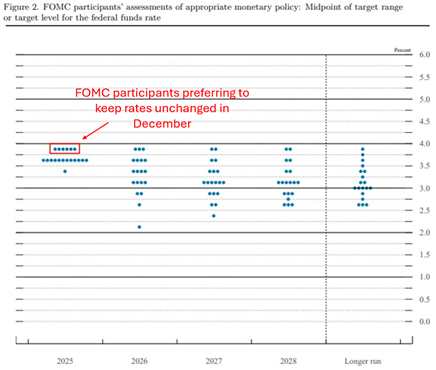
Source: Federal Reserve, from the Summary of Economic Projections.
Two camps are waging war at the Fed. In one camp are the doves, who still believe there are risks to the labor market that warrant further interest rate cuts. In the other camp are the hawks, who worry about persistent inflation. With each passing month, those two camps are becoming more balanced.
After 18 months of easing monetary policy, 2026 could turn out to be a year of transition.
Index Performance
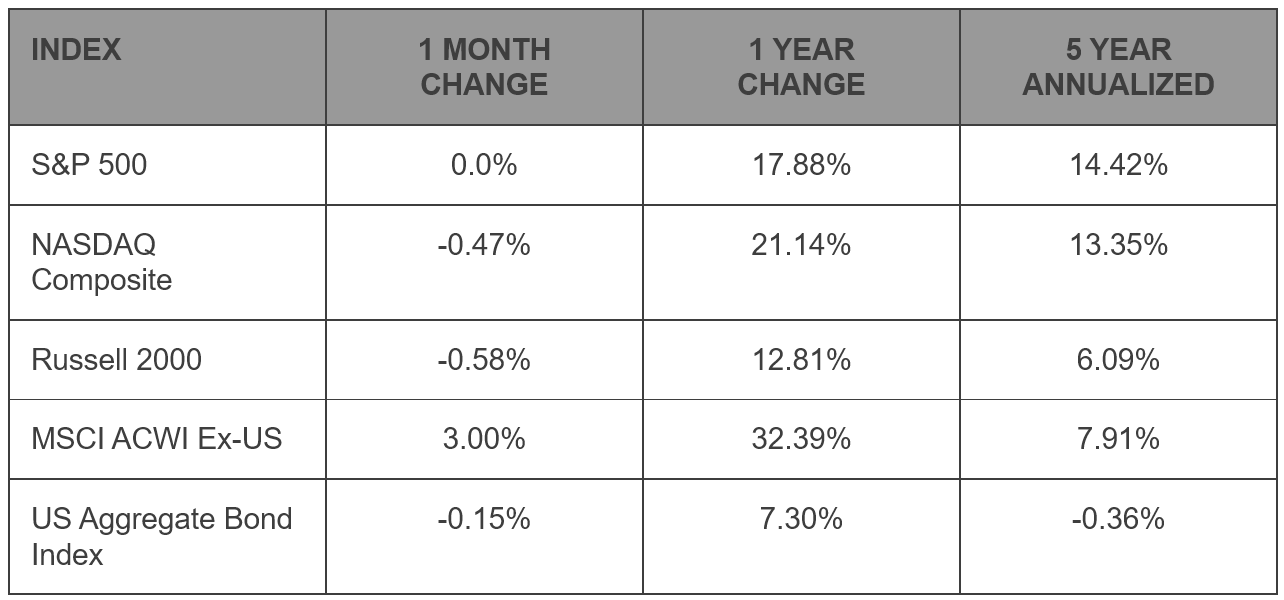
Stock returns were mixed during the month of December, as investors digested another interest rate cut from the Fed, some surprises in economic data releases, and growing concerns about elevated prices for AI-related stocks. The S&P 500 was virtually flat for the month, but both the tech-oriented NASDAQ Composite and the Russell 2000 Index of small caps declined. That did little to damage full year returns, however. US large cap stocks turned in double-digit gains for the third consecutive year.
2025 was even better for international equities. The MSCI ACWI Ex-US Index rose another 3% in December, bringing its year-to-date total to more than 30%. That’s the best performance for stocks outside the US since 2009.
S&P 500 Sector Highlights
Despite weakness in the first half of the year, the Mag 7 were back at the forefront in 2025. Communication Services rose 32% for the year, and Information Technology was up 23.3%.
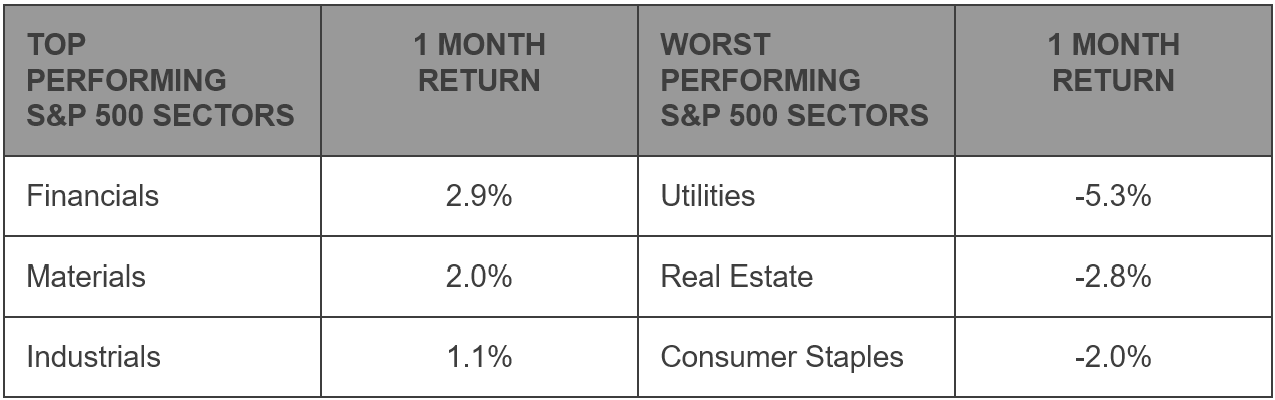
Market strength has certainly shifted over the past few months, though. First it was Health Care stocks that bottomed in late September, were among the leaders in October, and then surged during November. In December, it was traditional cyclicals that led – sectors like Financials, Materials, and Industrials that tend to correlate with broader economic activity.
One thing hasn’t changed, though. Investors don’t seem to be looking for risk-off assets. Consumer Staples, Utilities, and Real Estate, areas where investors usually go to seek income and stability, are at the bottom of return dashboard.
What to Watch in January
1/9 – BLS Jobs Report - December
The BLS finally released employment data that had long been delayed by the government shutdown. And even though employment grew faster than anticipated in November, the unemployment rate climbed to 4.6%. Excluding COVID, that’s the highest jobless rate since 2017. The December report likely includes more complete data that’s less muddied by the shutdown.
1/13 – Consumer Price Inflation - December
Economists had expected CPI to come in near 3% in November, with the effects of tariffs not beginning to roll off until sometime in Q1. Instead of 3%, core CPI dropped to 2.6%. That’s the lowest since 2021 and not far from the Fed’s 2% annual target.
1/14 – Retail Sales – December
In this monthly check-in on the health of the US consumer, we’ll see how well spending held up in the weeks before the holidays. About two-thirds of the US economy is driven by personal consumption, so a potential slowdown – or reacceleration – in retail sales has big ramifications.
1/22 – Q3 Gross Domestic Product
Both Q1 and Q2 GDP were skewed by importers working to front-run tariff implementation by stockpiling inventories last winter. The first estimate of Q3 GDP was delayed by the government shutdown and then surprised economists by rising at the fastest pace in over a year. This final estimate may offer clarity on how the US economy is actually performing – or perhaps we’ll just have to wait until the Q4 release.
1/28 – FOMC Rate Decision
The Federal Reserve meets again to decide the appropriate level of interest rates. In December, the Fed lowered rates by 0.25%, but the decision was marked by lots of differences in opinion on the FOMC. With Chair Jerome Powell’s tenure at the Fed coming to a close and the Trump administration likely to name they’re preferred replacement this month, this meeting could have plenty of fireworks.
Market Wrap: Bubble Talk
Ever since a Q1 GDP report indicated contraction in economic activity, we’ve been waiting for the impact of tariffs to roll off so we could see what growth actually looks like. The first quarter of 2025 included a pull forward of imports, as businesses worked to front run the looming implementation of tariffs. The mathematical impact of those imports was to decrease net exports in the calculation of Gross Domestic Product (GDP), thus pushing annualized growth into negative territory for the first time in 2 years. Unsurprisingly, the balance of trade reversed in Q2 - businesses who’d stockpiled inventories in Q1 didn’t need to import more goods, so net exports increased. All the unusual trade activity meant that in just 3 months, reported GDP growth surged from a multi-year low to a 12-month high.
Economists anxiously waited for some clarity in the third quarter release. Then the Q3 GDP release was delayed by an extended government shutdown, forcing them all to wait just a little bit longer.
But instead of clarity, most economists were left scratching their heads. Growth accelerated to a 4.3% annualized pace in the quarter, led by strength in personal consumption and (once again) net exports. The consensus estimate was for only 3.3% growth.
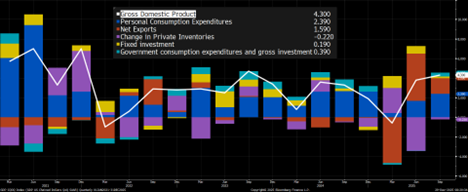
Source: Bloomberg Finance, L.P.
It’s possible that economic activity really has started to reaccelerate - S&P 500 earnings expectations certainly seem to support that - but it’s also possible that the data continues to be skewed by the Q1 pull-forward of imports and poor data quality in the wake of the government shutdown. Unfortunately, it’ll be another month before additional data is published to help fill in the gaps.
Stay tuned.
Bureau of Economic Analysis: https://www.bea.gov/data/gdp/gross-domestic-product
Bureau of Labor Statistics: https://www.bls.gov/
US Census Bureau: https://www.census.gov/retail/sales.html
Federal Reserve: https://www.federalreserve.gov/
New York Federal Reserve: https://www.newyorkfed.org/microeconomics/hhdc
Market performance data sourced from Bloomberg Finance L.P. and Optuma
Content in this material is for general information only and not intended to provide specific advice or recommendations for any individual. All performance referenced is historical and is no guarantee of future results. All indices are unmanaged and may not be invested into directly.
The Standard & Poor’s 500 Index is a capitalization weighted index of 500 stocks designed to measure performance of the broad domestic economy through changes in the aggregate market value of 500 stocks representing all major industries.
The NASDAQ Composite Index measures all NASDAQ domestic and non-U.S. based common stocks listed on The NASDAQ Stock Market. The market value, the last sale price multiplied by total shares outstanding, is calculated throughout the trading day, and is related to the total value of the Index.
The Russell 2000 Index is an unmanaged index generally representative of the 2,000 smallest companies in the Russell 3000 index, which represents approximately 10% of the total market capitalization of the Russell 3000 Index.
The economic forecasts set forth in this material may not develop as predicted and there can be no guarantee that strategies promoted will be successful.