
Convergence Commentary - January 2026
Quick Hits
Mixed drivers: Inflation fears, geopolitics, dollar doubts, and hard-asset demand all played a role.
Leverage unwind: Speculative, leveraged trades fueled the rally — then margin hikes forced a sharp selloff.
High volatility ahead: Gold and silver remain cyclical, risky, and debate-heavy assets.
Market-Moving Highlights
Jobs data continued to send mixed signals last month.
In early January, the BLS reported that the US added 50,000 nonfarm payrolls during the month of December, below the consensus estimate of 74,000. That capped off a year of rather lackluster net job gains. In 2025, average monthly payrolls growth was 49k, down from a 168k average in 2024, 216k in 2023, and 380k in 2022.
Despite the continued slowdown in December, though, the unemployment rate dropped back to 4.4% from a 4.6% reading in November.
That seeming divergence - weak jobs growth coupled with a falling unemployment rate - reflects a labor market that’s seeing both the supply of and the demand for workers slow. And it puts the Federal Reserve in a precarious position as they weigh their next interest rate moves.
Of course, there was plenty more for the Fed to think about last month. The Department of Justice is investigating Chair Jerome Powell on criminal charges relating to testimony he made last year about Fed building renovations. Powell has mostly kept his thoughts to himself when it’s come to the President’s outspoken opinion on interest rates. He was more vocal after news broke about the investigation:
“This new threat is not about my testimony last June or about the renovation of the Federal Reserve buildings. It is not about Congress’s oversight role; the Fed, through testimony and other public disclosures, made every effort to keep Congress informed about the renovation project. Those are pretexts. The threat of criminal charges is a consequence of the Federal Reserve setting interest rates based on our best assessment of what will serve the public, rather than following the preferences of the president.”
Powell’s term as Fed Chair ends in May, though he could choose to stay on as a governor until 2028. Kevin Warsh, a Fed governor from 2006-2011 and ally of President Trump, has been tapped to succeed him.
First, Warsh will need to gain Senate approval. Thom Tillis, a retiring Republican senator from North Carolina and a member of the Senate banking panel, has publicly said he won’t support any nominee until the DOJ’s investigation into Powell is ‘fully and transparently resolved.’ That may prevent Warsh’s nomination from moving forward for the time being.
Index Performance
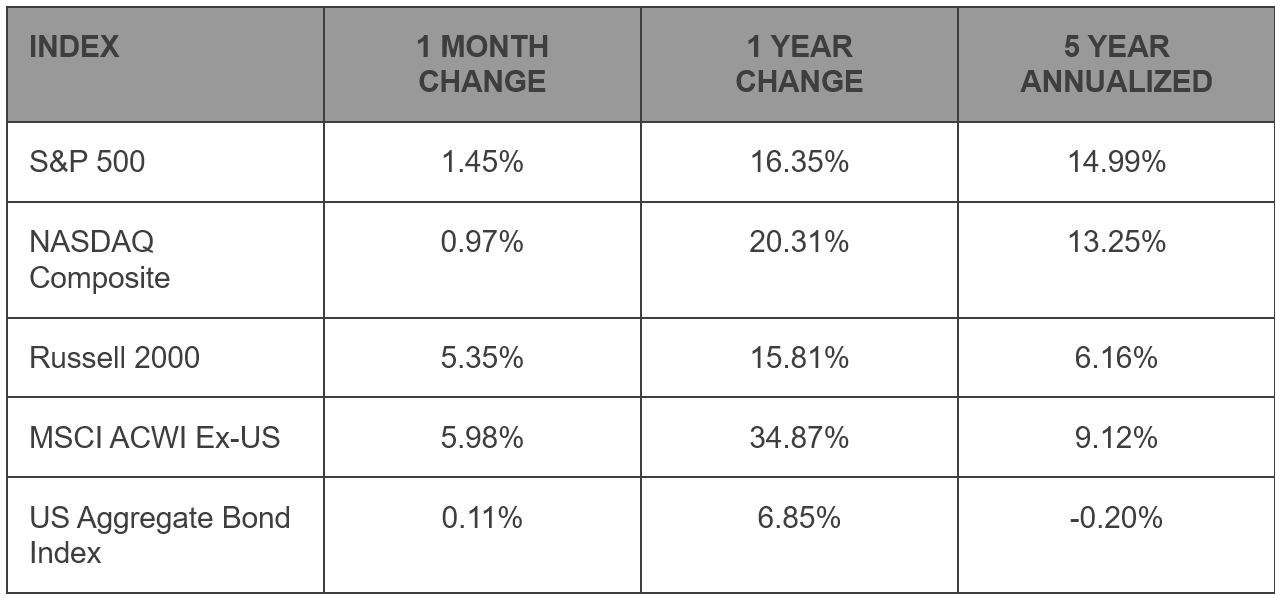
Despite a volatile final week, stocks managed to turn in positive performances for the month of January. After several years of leadership, the growth-oriented NASDAQ Composite was the weakest of the major indices for the month, rising just under 1%.
It was value-oriented stocks that outperformed instead. The Russell 2000 index of small caps and the MSCI ACWI EX-US Index each rose more than 5%. Those two groups have higher exposure to traditional cyclicals and value sectors like Industrials and Energy, and less exposure to Information Technology. For international stocks, it added to an already strong performance from calendar year 2025. They’re now up nearly 35% over the last 12 months.
S&P 500 Sector Highlights
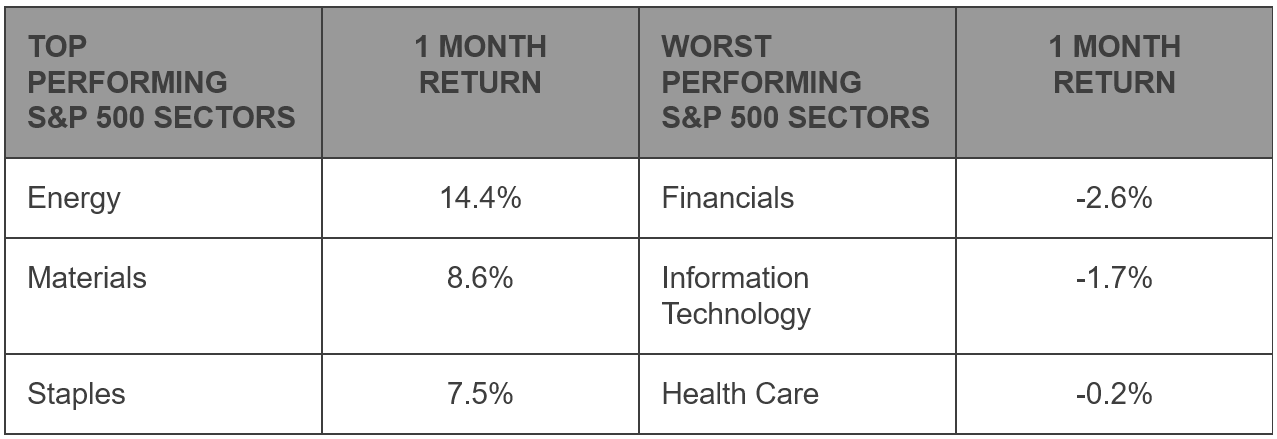
In the three-and-a-half years prior to January, few sectors performed as poorly as Energy. Thanks in large part to steadily falling oil prices, the sector had struggled to surpass its June 2022 peak. In January, however, S&P 500 Energy stocks gained 14% and touched a new all-time high. Once again, oil prices drove the move. The Materials sector, also benefitting from a broad-based rise in commodities prices, jumped 8.6%.
The Information Technology sector fell 1.7% as investors continued to digest rapid changes in AI development, capital spending projects, and financing. Financials were the worst performers after a handful of disappointing earnings announcements from the country’s largest banks. And Health Care fell after smaller-than-expected Medicare Advantage reimbursement rates sent managed care stocks sharply lower.
What to Watch in February
2/4 – US Treasury Quarterly Refunding Announcement
This release outlines how much the US government plans to borrow in the coming months and the mix of securities it will issue. Unexpected changes – like a shift in the maturities being offered – can trigger large moves in the bond market. This one could prove particularly important as traders also digest the announcement of Kevin Warsh’s nomination to lead the Federal Reserve. He’s been a vocal critic of the Fed’s bond-buying initiatives over the years.
2/6 – DELAYED – BLS Jobs Report - January
Originally scheduled for 2/6, the partial government shutdown has delayed the release of the latest jobs numbers. Tentatively, we expect to see this report published around the middle of the month. December jobs growth showed continuing slowing, yet the unemployment rate ticked down. That divergence points to a contraction in both the supply of and demand for labor.
2/11 – Consumer Price Inflation - January
Core CPI is expected to drop to 2.4% from a 2.6% reading in December. That would be the lowest since 2021 and not far from the Fed’s 2% annual target. However, it’s possible that delayed pass-through of tariff costs could cause an upside surprise to inflation in the first half of 2026.
2/17 – Retail Sales – January
In this monthly check-in on the health of the US consumer, we’ll see how well spending held up in the weeks after the holidays. About two-thirds of the US economy is driven by personal consumption, so a potential slowdown – or reacceleration – in retail sales has big ramifications. Future months will be even more important, as consumers are set to pocket large tax refunds following the passage of the One Big Beautiful Bill.
2/20 – Q4 Gross Domestic Product
The first 3 quarters of GDP in 2025 were skewed by importers working to front-run tariff implementation by stockpiling inventories last winter, and then unwinding those inventories. We still haven’t seen a ‘clean’ GDP report that gives a clear view of how the US economy is actually doing. Perhaps the Q4 report is what we’ve been waiting for.
Market Wrap: Madness in the Metals Market
Few topics in finance arouse such strong opinions as precious metals. On the one hand, gold and silver have been accepted as mediums of exchange and stores of value for thousands of years. On the other, they have limited usefulness in the industrial world, which makes it rather difficult to justify meaningful price appreciation.
Even among the most respected names in the investment community, there’s a glaring lack of consensus. There’s legendary investor Warren Buffett:
“Gold gets dug out of the ground in Africa, or somewhere. Then we melt it down, dig another hole, bury it again, and pay people to stand around guarding it. It has no utility.”
And then there’s Ray Dalio:
“If you don’t own gold, you know neither history nor economics.”
It’s a debate that probably won’t be settled in our lifetimes. In any case, metals are moving.
US stock prices rose by double digits for each of the last 3 calendar years, resulting in a cumulative gain of nearly 50% for the S&P 500 index. Impressive as it was, that rally was surpassed by huge gains in the prices of precious metals. After going virtually nowhere for the 10 years prior to 2021, the value of gold more than doubled from 2023-2025. Silver nearly tripled.
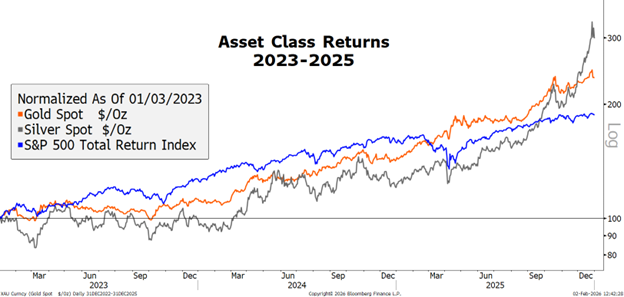
Source: Bloomberg Finance, L.P.
What’s been driving the move? Ask some, they’ll swear it’s currency debasement and the end of US Dollar dominance. Ask others, it’s a reflection of the tenuous balance of global geopolitics. Still others point to metals-crazed retail investors and leveraged bets.
Most likely, it’s a combination of all these tailwinds. Undoubtedly, the rebirth of inflation since 2021 has contributed some to the preference for ‘hard assets’. And geopolitical risks abound: There’s the ongoing wars in Eastern Europe and the Middle East. Taiwan could be the epicenter of a major conflict between the US and China. Global trade wars have weakened relationships between former allies. The list goes on.
What we know for sure is that gold and silver can be risky assets. Just like every other investment, sometimes they go up, sometimes they don’t. And investors saw both sides of the coin in January. After a breathtaking rally over the first 3 weeks of the year, gold last Friday dropped 9%. And silver? It collapsed a whopping 26%. Our data goes back to the 1960s, and we haven’t been able to find a one-day drop like that, ever. Not even when the Hunt brothers tried and failed to corner the market in 1980.
The nearly unprecedented volatility implies that significant leverage is at play. As further confirmation, the selloff followed a decision by the CME in recent weeks to raise margin requirements on precious metals futures contracts. Those increased margin requirements were in direct response to higher volatility and likely contributed to the selloff by triggering forced liquidations.
The story of gold and silver is far from over. They’re historically prone to years – even decades – of extreme strength or extended weakness. No matter what, they’re sure to spark intense debates among investors for the foreseeable future.
Stay tuned.
Bureau of Economic Analysis: https://www.bea.gov/data/gdp/gross-domestic-product
Bureau of Labor Statistics: https://www.bls.gov/
US Census Bureau: https://www.census.gov/retail/sales.html
Federal Reserve: https://www.federalreserve.gov/
New York Federal Reserve: https://www.newyorkfed.org/microeconomics/hhdc
Market performance data sourced from Bloomberg Finance L.P. and Optuma
Disclosures:
Content in this material is for general information only and not intended to provide specific advice or recommendations for any individual. All performance referenced is historical and is no guarantee of future results. All indices are unmanaged and may not be invested into directly.
The Standard & Poor’s 500 Index is a capitalization weighted index of 500 stocks designed to measure performance of the broad domestic economy through changes in the aggregate market value of 500 stocks representing all major industries.
The NASDAQ Composite Index measures all NASDAQ domestic and non-U.S. based common stocks listed on The NASDAQ Stock Market. The market value, the last sale price multiplied by total shares outstanding, is calculated throughout the trading day, and is related to the total value of the Index.
The Russell 2000 Index is an unmanaged index generally representative of the 2,000 smallest companies in the Russell 3000 index, which represents approximately 10% of the total market capitalization of the Russell 3000 Index.
The Bloomberg U.S. Aggregate Bond Index is an index of the U.S. investment-grade fixed-rate bond market, including both government and corporate bonds.
The MSCI ACWI ex USA Index captures large and mid cap representation across Developed Markets (DM) countries (excluding the US) and Emerging Markets (EM) countries. The index covers approximately 85% of the global equity opportunity set outside the US.
Precious metal investing involves greater fluctuation and potential for losses.