
Convergence Commentary - February 2026
Quick Hits
Tariffs: SCOTUS blocks Trump-era tariffs; new 15% global duty in place.
Markets: S&P flat, NASDAQ down, small-cap/value stocks up.
Watch: Jobs, CPI, GDP, Fed; Iran strikes push oil higher.
Market-Moving Highlights
A Supreme Court ruling last month struck down most of the tariffs put in place by the Trump Administration in 2025. In a 6-to-3 ruling, America’s highest judicial authority ruled Trump overstepped his power when he used federal emergency measures to implement the tariffs.
In response, Trump announced a new 10% global duty, which was subsequently raised to 15%. The new tariff, under Section 122, requires no formal investigation or process before implementation and can continue for 150 days before requiring Congressional approval.
The Administration has several other tools at their disposal, too:
Section 301 of the Trade Act of 1974 can be used in response to unfair trade practices. It requires an investigation first, so it would take a few months to implement. However, there is no limit to the level of tariffs or their duration.
Section 232 of the Trade Expansion Act of 1962 allows for tariffs based on National Security concerns. It’s already being used for tariffs on things like steel, aluminum, copper, and autos.
Section 338 of the Trade Act of 1930 would be a 50% tariff on imports from countries that discriminate against the US. The level of tariffs is limited but putting them in place does not require an investigation.
In any case, it doesn’t look like the Supreme Court’s decision will force the Administration to reverse global trade policy any time soon.
Index Performance
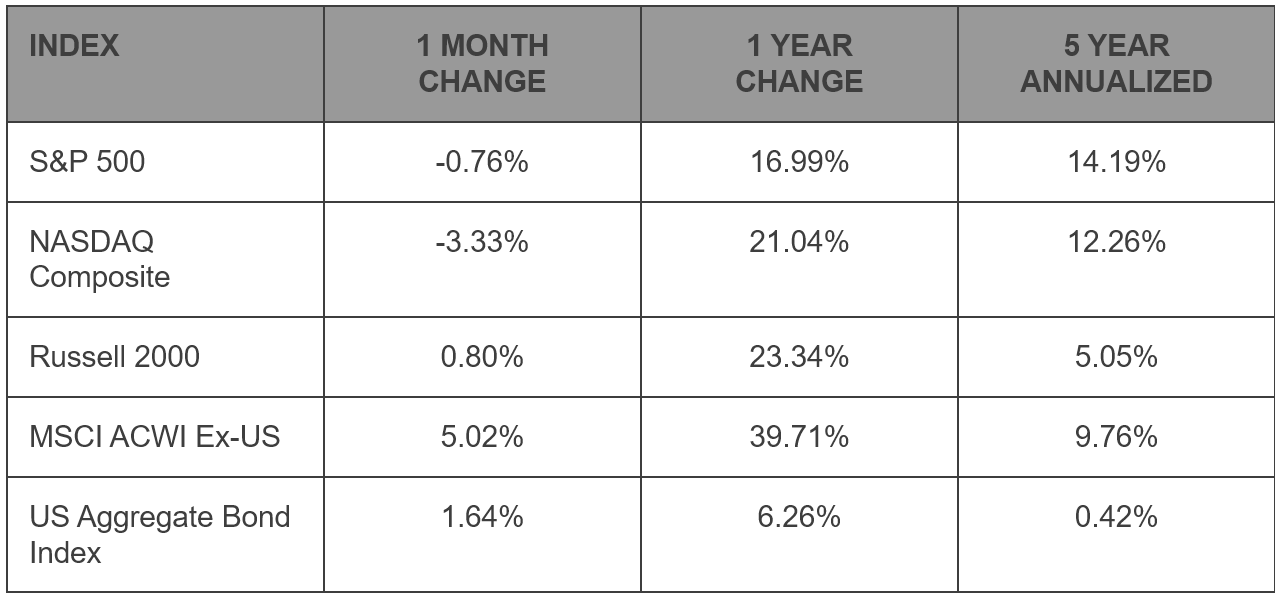
There’s a growing dichotomy in US equity markets. Since the end of last October, the S&P 500 index is largely unchanged. Over that same period, however, the NASDAQ Composite has fallen 4%, and the Russell 2000 Index of small caps has risen more than 6%. The dispersion reflects a shift in leadership - away from mega cap growth and ‘Magnificent 7’ stocks and into formerly unloved value stocks.
The same was true in February. The NASDAQ fell 3.3%, the Russell 2000 rose 0.8%, and the S&P 500 fell a modest 0.8%. But below the surface, US equities are more healthy than they appear. The S&P 500 is a market cap-weighted index, meaning the largest stocks have the largest impact on index performance. The equally weighted S&P 500, which treats every stock the same, jumped 3.5% during the month. That nearly matches the 5% gain in international equities.
Foreign stocks outperformed those in the US in 2025, too. But the calendar year return statistics mask what really happened last year. All the international outperformance came in Q1 - which itself followed an absolutely dismal Q4 2024. Put those 5 quarters together, and the returns for the S&P 500 and the MSCI ACWI ex-US were nearly identical.
Things look a little different this year. There’s no major Q4 selloff to bounce back from, yet the international index has risen more than 11%, while the S&P 500 is roughly flat.
S&P 500 Sector Highlights
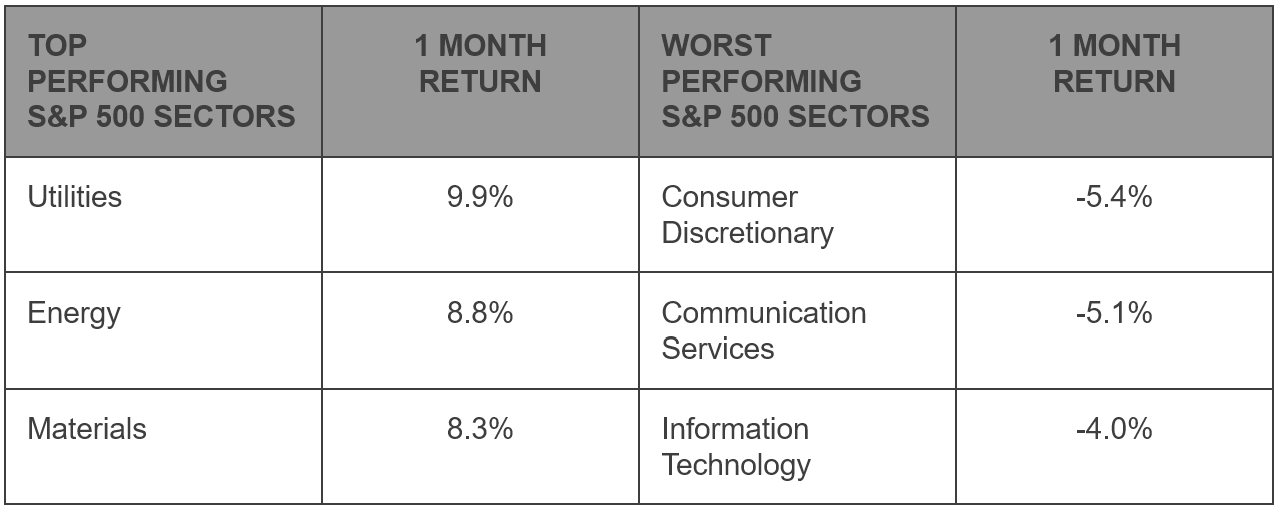
The performance dispersion was even more apparent at the sector level. The three sectors most heavily tilted toward mega cap growth – Consumer Discretionary, Communication Services, and Information Technology – were the worst three performers in February. Each fell at least 4%. On the other side of the spectrum, sectors with a tilt towards value surged. Utilities rose nearly 10% for the month. Energy and Materials, two of the top sectors in January, as well, each rose more than 8%.
An astute observer might question how the S&P 500 Index as a whole could fall 0.8% in a month when its best sectors rose 8-10% and the worst only fell 4-6%. The answer, once again, comes down to index construction. In terms of market capitalization, Energy, Utilities, and Materials rank 8th, 9th, and 10th, respectively, out of 11 S&P 500 sectors. Together, they comprise just over 8% of the total index.
The Information Technology sector? It comprises 32% of the index, and the largest stock alone, NVIDIA, makes up more than 7%.
What to Watch in February
3/6 - BLS Jobs Report – February
The labor market in January added 130,000 jobs to the nonfarm payrolls report, twice as many as expected by the average economist, and the most for any month since December 2024. For February, the consensus estimate implies that jobs growth will revert to a more modest 60,000 per month rate.
3/11 – Consumer Price Inflation - February
CPI fell to 2.4% year-over-year in January, down from a 2.7% reading in the month prior. That was among the lowest rates since 2021 and not far from the Fed’s 2% annual target. However, it’s possible that delayed pass-through of tariff costs could cause an upside surprise to inflation in the first half of 2026. Wholesale prices, as measured by the Core Producer Price Index, jumped to 3.6% in January. That was the highest print since last spring.
3/13 – Q4 Gross Domestic Product
For months, we lamented that the pull-forward of imports in Q1 2025 had skewed the calculation of GDP. The impacts were still being felt in Q2 and Q3, making it hard to determine the ‘true’ level of growth in the US economy. It finally happened in Q4: the impacts of net exports and inventories on the calculation of GDP were virtually non-existent. Does that mean we finally had a clean print? Not quite. Thanks to the longest government shutdown in US history, government spending in Q4 fell by the most since 1972.
3/18 – FOMC Rate Decision
The Federal Reserve meets again to decide the appropriate level of interest rates. In January, the Fed left interest rates unchanged, but the decision was overshadowed by political differences, including a DOJ investigation into Chair Jay Powell. Powell’s term expires in May, and Kevin Warsh has been nominated to replace him. Warsh, however, won’t have much sway until he’s confirmed by the Senate to his position as a governor. This month, Fed officials seem to be coalescing around a ‘no change’ decision.
Market Wrap: Madness in the Metals Market
The United States and Israel launched a joint strike against Iran over the weekend, killing Ayatollah Ali Khamenei, Iran’s Supreme Leader, and several other top Iranian officials. The strike prompted retaliatory missile launches from Iran, and President Trump later warned in an interview that the conflict could last for weeks.
Unsurprisingly, oil prices are surged on the news. The Strait of Hormuz - a key shipping lane that borders Iran and carries a fifth of the world’s oil- effectively closed after most major oil companies and trading houses temporarily suspended shipments through the area, and Iranian strikes have already forced Qatar to halt LNG production.
The longer-term impact on oil prices, however, is less clear. Some strategists believe that energy prices might even fall in the coming months, arguing that the strikes handicapped Iran’s navy and hamstrung their ability to blockade the Strait. And for now, it doesn’t appear that Iran’s oil production and export facilities have been impacted.
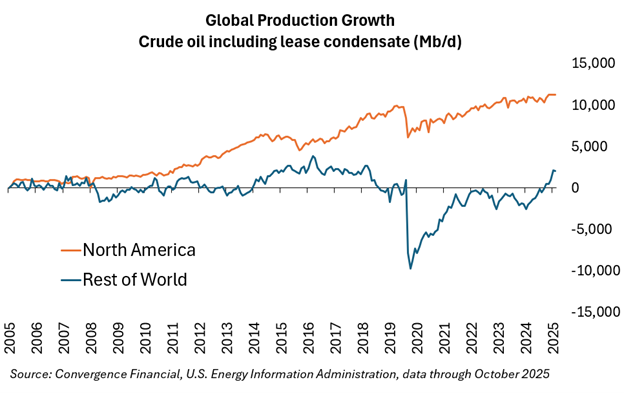
It’s also important to remember that the Middle East’s influence on global oil prices has waned in recent years. For that, thank the US shale revolution and growing production here at home. The United States pumps more oil than any other country in the world, and North America has accounted for virtually all of global oil production growth over the last 20 years.
Bureau of Economic Analysis: https://www.bea.gov/data/gdp/gross-domestic-product
Bureau of Labor Statistics: https://www.bls.gov/
US Census Bureau: https://www.census.gov/retail/sales.html
Federal Reserve: https://www.federalreserve.gov/
New York Federal Reserve: https://www.newyorkfed.org/microeconomics/hhdc
Market performance data sourced from Bloomberg Finance L.P. and Optuma
Disclosures:
Content in this material is for general information only and not intended to provide specific advice or recommendations for any individual. All performance referenced is historical and is no guarantee of future results. All indices are unmanaged and may not be invested into directly.
The Standard & Poor’s 500 Index is a capitalization weighted index of 500 stocks designed to measure performance of the broad domestic economy through changes in the aggregate market value of 500 stocks representing all major industries.
The NASDAQ Composite Index measures all NASDAQ domestic and non-U.S. based common stocks listed on The NASDAQ Stock Market. The market value, the last sale price multiplied by total shares outstanding, is calculated throughout the trading day, and is related to the total value of the Index.
The Russell 2000 Index is an unmanaged index generally representative of the 2,000 smallest companies in the Russell 3000 index, which represents approximately 10% of the total market capitalization of the Russell 3000 Index.
The Bloomberg U.S. Aggregate Bond Index is an index of the U.S. investment-grade fixed-rate bond market, including both government and corporate bonds.
The MSCI ACWI ex USA Index captures large and mid cap representation across Developed Markets (DM) countries (excluding the US) and Emerging Markets (EM) countries. The index covers approximately 85% of the global equity opportunity set outside the US.
Precious metal investing involves greater fluctuation and potential for losses.