
Convergence Commentary - July 2025
Quick Hits
Market-Moving Highlights
Summers are usually a sleepy stretch for financial markets. Since the advent of the S&P 500 index in 1950, only December has seen fewer one-day moves of at least 1% than the month of July. And by that measure, the last several weeks have been quite sleepy indeed. At the end of the month, it had been 27 trading days since the last 1% move for the S&P 500, the longest stretch since last fall and among the longest streaks of the 21st century.
The slow and steady price action did not match the pace of news flow. Throughout July, we were buffeted by passage of the One Big Beautiful Bill, threats to replace the Chair of the Federal Reserve, and a plethora of tariff announcements and last-minute trade deals. And that was just what came out of the White House.
We also saw continued resilience in the labor market, a sharp rebound in Q2 GDP, and stubbornly elevated inflation readings. Those developments gave Jerome Powell cover to maintain the current stance of monetary policy at last week’s FOMC meeting, despite overwhelming political pressure to cut interest rates. But the Chair’s support within the Committee appears to waning. For the first time since 1993, two Fed governors dissented from the interest rate decision.
Those favoring a cut were led by Christopher Waller, a front-runner to replace Powell when his term expires next spring, and one of the Fed’s leading economic voices. Waller argues that traditional measures of the labor market overstate its health, and so-called ‘soft data’ paint a more tenuous picture. He also believes the effect of tariffs on inflation will be transitory, one-time impacts. Powell agrees that downside risks to the labor market have risen, but he’s less sanguine than his colleague about the inflation outlook. With the Fed’s preferred measure of prices rising to 2.6% in June and having made no progress towards their 2% target over the past 18 months, Powell argues that the Committee is further away from achieving the ‘price stability’ component of their dual mandate than they are ‘full employment’. And that warrants a continuation of moderately restrictive policy.
For their part, traders seemed to think Powell has the upper hand. By the end of his post[1]meeting press conference, futures markets were pricing in just 0.33% of cuts for the rest of the year, the least since mid-February. That trend reversed almost immediately with the August 1 jobs report, which included significant downward revisions to previously posted job gains.
Stay tuned.
Index Performance
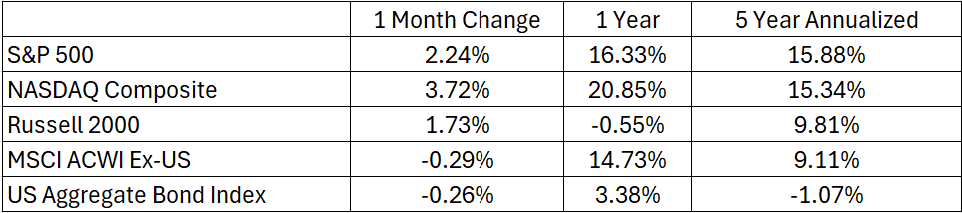
The S&P 500 rose another 2% in July, setting a new all-time monthly closing high. The NASDAQ Composite rose even more, adding 3.7% and reaching a new high of its own. Both the S&P 500 and the NASDAQ are up more than 15% over the last 12 months. Outside of the mega caps, though, US indices aren’t quite as strong. Each the Dow Jones Industrial Average, the Russell 2000 small cap index, and the equally weighted S&P 500 are still stuck below their 2024 highs.
International stocks were largely unchanged in July, but even though they lagged domestic equities last month, they’ve still outperformed by a wide margin year-to-date. Since December, the MSCI ACWI Ex-US has risen more than 17%. Interest rates rose during the month, pushing prices lower and adding to the malaise that has struck bonds over the past 5 years.
S&P 500 Sector Highlights
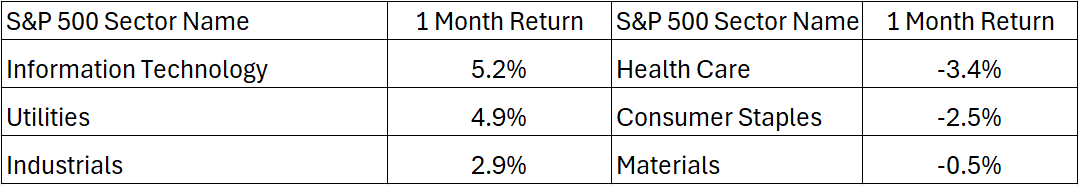
For the third consecutive month, Information Technology was the best performing large cap sector. The recent strength only adds to an astonishing level of dominance over the past decade: Since mid-2015, no other S&P 500 sector has managed to outperform the index, let alone match the performance of Information Technology. In other words, 10 of the 11 sectors have been below ‘average’ – an average egregiously skewed by Tech’s stratospheric run.
On the downside, Health Care stocks continued to get routed. Already among the worst sectors of the year by the end of June, Health Care dropped another 3.4% in July, dragged down by companies suffering from elevated medical costs and an unfavorable regulatory
environment. Similarly, Consumer Staples stocks fell out of favor amid a tough margin backdrop in the face of rising input prices.
What to Watch in August
8/7 – Tariff Implementation
These deadlines keep getting kicked down the road, but this date seems to be ‘final’. On August 7, US Customs will begin collecting import duties at the rates prescribed by the White House on July 31.
8/12 – Consumer Price Index - July
Progress on price inflation stalled in the back half of 2024, and that’s a big reason the Fed was forced to adjust their policy outlook for 2025. Even with the labor market showing cracks, it’ll be tough for policymakers to loosen their grip on growth without seeing receding price pressure. Core CPI is expected to rise to 3.0% in July from 2.9%.
8/15 – Retail Sales – July
Retail sales rebounded in June after a weak May, rising 0.5% sequentially. July’s number could show even more strength, as the country’s two largest retailers – Amazon and Walmart – held a week-long sale designed to boost slow summer sales. If the upcoming report from the Census Bureau disappoints in spite of all that, it could mean consumers are finally starting to feel pressure from higher prices and a softening labor market.
8/21-23 – Jackson Hole Symposium
The Federal Reserve isn’t scheduled to hold its next rate policy meeting until September, but interest rate policy is only one tool at the Fed’s disposal. They transmit much of their policy these days through ‘forward guidance’. Each year in August, the Federal Reserve Bank of Kansas City hosts an economic symposium in Jackson Hole Wyoming, inviting some of the most influential policy makers in the world. Fed Chair Jerome Powell will undoubtedly take the stage, where he could give a clear indication about plans for a policy shift in September.
8/28 – GDP – Q2, second estimate
The first estimate of Q2 GDP showed that the US economy rebounded 3.0%, following a contraction in Q1. Both Q1 and Q2 were skewed by importers working to front-run tariff implementation by stockpiling inventories last winter. Those effects were virtually zero-sum over the first half, however, which means we can get a reasonable read on US growth by averaging the two reports. Doing so implies that GDP grew at a 1.3% rate in the first half – positive, but clearly moderating.
Market Wrap
Keeping track of tariff levels and trade deal announcements is a full-time job. Last month alone, the US either struck a deal with, or agreed to delay tariff implementation on, Japan, the EU, South Korea, Pakistan, Mexico, Philippines, Indonesia, and Vietnam. To complicate matters, each of these deals comes with its own set of rates and exemptions, and many of them lack explicit details.
All these rapid changes make it difficult for economists, analysts, and policymakers alike to gauge the exact impact of the Trump Administration’s actions on trade. We can confidently rely on broad estimates (the new average tariff rate on US imports is set to land between 15 and 20%, up from about 2.5% last year, and US Customs is set to rake in roughly $30 billion a month in import duties, from about $7.5 billion – but the finer details can be tricky.
The most glaring recent example was copper. Copper is among the most important commodities in the world, thanks to its applications within modern infrastructure and energy transmission. Unsurprisingly, copper is also the most actively traded base metal in the world. With actively traded markets come traders and analysts - people that know their product inside and out. Surely those people wouldn’t be caught off guard by the signing of an already-announced 50% tariff on copper, right?
Wrong.
On July 30, President Trump signed a Presidential Proclamation that imposed a 50% tariff on certain copper products. ‘Certain’ was the key word. The tariffs - initially threatened on July 9 – will only apply to semi-finished copper products, not to refined materials. And that distinction caught markets by surprise. Copper prices on the COMEX dropped a staggering 22% in one day, by far the largest single-day drop since the metal began trading in 1988.

Analysts who spend all day looking at trade policy still don’t know exactly what to make of it. Business decision-makers are surely in the same boat.
Bureau of Economic Analysis: https://www.bea.gov/data/gdp/gross-domestic-product
Bureau of Labor Statistics: https://www.bls.gov/
US Census Bureau: https://www.census.gov/retail/sales.html
Federal Reserve: https://www.federalreserve.gov/
Market performance data sourced from Bloomberg Finance L.P. and Optuma