
Convergence Commentary - September 2025
Quick Hits
Market-Moving Highlights
The Federal Reserve resumed its interest rate cutting cycle after a nine-month hiatus, helping push stock prices to new highs in September. The latest cut reflects a shift in the Fed’s focus - they now believe the risks to employment outweigh the risks to higher inflation, a view which supports less restrictive policy.
At his post-meeting press conference, Fed Chair Jerome Powell indicated that further cuts could be coming in the months ahead. Alas, that path forward is far from certain. There’s an internal power struggle at the Federal Reserve. Stephen Miran, the most recent appointee to the Fed and a close ally to President Trump, is publicly advocating for a series of 50 basis point interest rate cuts. He argues that current Fed policy is far too restrictive in light of structural changes to the US economy, and thus risks tipping the economy into recession. His target for short-term interest rates at the end of 2025 is three quarters of a percent lower than any of his 18 colleagues at the Fed.
Those target rate estimates come from the Summary of Economic Projections, a quarterly release from the Fed that details FOMC members’ views about growth, unemployment, inflation, and policy over the coming years. This edition of the SEP contained a few other interesting pieces of data.
The Fed’s mandate from Congress is to pursue maximum employment and price stability. Yet in a meeting where Fed officials cut interest rates to buoy the labor market, those same officials, on average, revised down their expectations for unemployment and increased their expectations for next years’ already elevated level of inflation.
Perhaps that’s why Fed members like Raphael Bostic, President of the Atlanta Fed, and Beth Hammack, Cleveland, have pushed back on any further interest rate cuts for 2025.
Index Performance
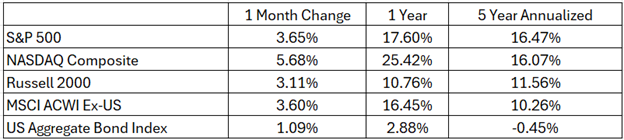
Risk assets responded with favor to the Fed’s decision to cut rates. The S&P 500 rose another 3% in September, setting a new all-time monthly closing high. The NASDAQ Composite was the leader for the month, gaining 5% and bringing that index’s tally to more than 25% for the past year. Both small cap stocks and international equities – areas that have lagged US large caps over the past 5 years – kept pace in September, rising 3%.
Interest rates, meanwhile, fell in August, pushing the US Aggregate Bond Index up 1% for the second straight month.
S&P 500 Sector Highlights
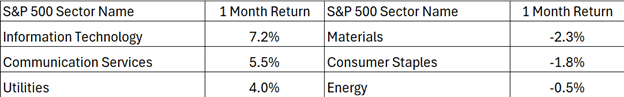
Large cap growth returned to the leaderboard in September after a 1-month hiatus. The Information Technology sector rose 7%, fueled by a resumption of the AI rally that’s driven stocks over the past 24 months. Communication Services stocks rose 5.5%, another healthy gain for the sector that’s leading the way in 2025. Utilities stocks rebounded 4% after dropping 2% in August.
On the downside, Materials stocks fell 2%, dragged lower by a sharp decline in one of the world’s largest copper miners. Consumer Staples also continued to lag, further evidence that investors today prefer cyclical assets to defensive ones.
What to Watch in October
10/3 – BLS Jobs Report – September
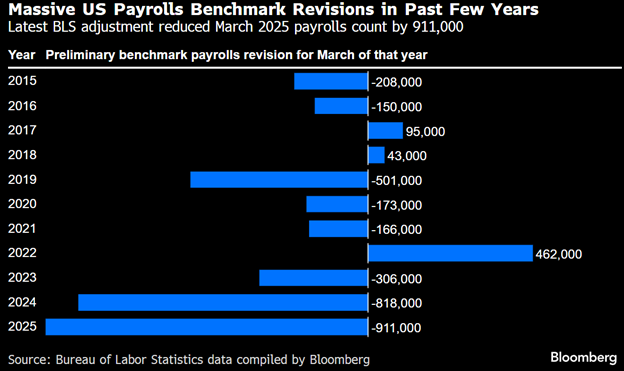
Payrolls growth has moderated significantly over the past year, thanks to large downward revisions from the BLS over the past several months. That labor market softening helped the Federal Reserve justify a resumption of interest rate cuts last month. Going forward, the pace of future cuts will largely depend on employment data like this.
10/15 – Consumer Price Index - September
Progress on price inflation stalled in the back half of 2024, and that’s a big reason the Fed was forced to adjust their policy outlook for 2025. Labor market softening triggered a 0.25% cut in September, but inflation has remained stubbornly elevated. If it continues to do so, the Fed may not be able to provide ongoing support to the economy with further rate cuts.
10/16 – Retail Sales – September
Retail sales surged in August, thanks to a strong back to school shopping season. Consumption makes up about two-thirds of the US economy, and those all-important consumers continue to shake off uncertainty about tariff and interest rate policy. This month’s release could contain early glimpses of the holiday.
10/29 – FOMC Decision
After cutting rates in September, the Fed will weigh a wide range of viewpoints in deciding how to proceed with policy over the final months of the year. Before that decision, they should have plenty of economic data to digest.
10/30 – GDP – Q3, first estimate
Second quarter GDP was revised up to 3.8% from a 3.3% annualized rate. Both Q1 and Q2 were skewed by importers working to front-run tariff implementation by stockpiling inventories last winter. This first estimate of Q3 GDP will give a cleaner look at how the US economy is actually performing.
Market Wrap
Why did God create economists? To make weather forecasters look good.
The Bureau of Labor Statistics has been the target of plenty of headlines over the past few months. First, a jobs report in early August included significant negative revisions to data from prior months, prompting President Trump to publicly fire the BLS Commissioner. Then in September, an annual benchmark revision to the payrolls data showed that the US economy added 911,000 fewer jobs between March 2024 and March 2025 than initially estimated. The revisions seem to grow in magnitude every year.
What’s the problem? Are there bad actors at the BLS, working overtime to sabotage the current political regime? We suppose that’s possible. The more likely issue, though, is that the US economy is freakishly huge and devilishly hard to measure.
The BLS surveys over one hundred thousand businesses to compile its monthly estimate of payroll additions, but survey responses often arrive several weeks after the initial report is made. Late responses can mean significant adjustments to early releases. And remember, these are just samples of the US economy. The survey only covers about a third of all employees in the US, so the remaining two-thirds must be imputed – a task made more difficult by recent structural shifts in the US labor market that have altered historical relationships. Larger revisions like the one in September come from adjusting the survey results to align with unemployment insurance tax records (more comprehensive, but less timely).
And that’s just one data set economists must rely on. Measuring inflation is no less tricky, nor is GDP, unemployment, or consumer spending.
We’ve a long-held view that policy makers are a lot like umpires. Complaining about them can be a lot of fun, and it’s easy to dissect decisions in slow motion and with the benefit of hindsight. But just as most baseball fans don’t know the intricacies of the rule book, it’s virtually impossible to fully grasp the puts and takes of policy decisions in a global economy. And the job of policy makers is made even harder by data that’s constantly revised – akin to an umpire trying to call balls and strikes when home plate is moving around during every pitch.
Bureau of Economic Analysis: https://www.bea.gov/data/gdp/gross-domestic-product
Bureau of Labor Statistics: https://www.bls.gov/
US Census Bureau: https://www.census.gov/retail/sales.html
Federal Reserve: https://www.federalreserve.gov/
Market performance data sourced from Bloomberg Finance L.P. and Optuma