
Convergence Commentary - May 2026
Quick Hits
AI boom: AI growth continues to drive tech stocks and market gains.
Iran tensions: Oil markets remain volatile amid ceasefire uncertainty.
Fed shift: New Fed leadership faces rising inflation and higher-rate expectations.
Market-Moving Highlights
Three overarching storylines seem to be driving the markets today, and we’ve regularly addressed each of them in our commentaries this year.
The first is Artificial Intelligence. All over the world, people and businesses are incorporating AI into their daily routines. Whether it’s automating workflows, processing data, or drafting complex documents, AI has the potential to materially boost productivity. With increased usage comes the need for more capacity, and with capacity buildout comes increased spending and, as a result, higher net incomes for technology suppliers.
Next is war with Iran. Oil tanker traffic through the Strait of Hormuz remains severely limited, and global oil inventories are dwindling. Rumors of a deal between the US and Iran swirl and shift from day to day, leaving everyone – sometimes even the negotiators themselves – uncertain of where things stand. WTI crude oil prices ended May at a 6-week low, trading below $90 per barrel on news of an imminent deal to extend the ceasefire by around two months, with Iran reopening the strait and the US lifting a blockade of Iranian ports. The winds promptly shifted again. Iran halted talks on June 1, citing ceasefire violations.
Third is the Fed. There was no FOMC meeting in May, but it was still a big month for the Federal Reserve. Kevin Warsh was confirmed to the Board of Governors at the Federal Reserve, and subsequently to the role of Chairman. Jerome Powell, meanwhile, chose to stay on at the Fed as a governor, even though his term as Chair is ended.
Warsh takes over at a precarious moment for monetary policy. Though President Trump nominated Warsh with the expectation that he’d push the Fed to lower interest rates, Warsh will have a tough time convincing the rest of the FOMC to loosen policy at a time when inflation is back on the rise. In fact, federal funds futures imply that Warsh’s Fed is more likely to raise interest rates than lower them over the next year.
Index Performance
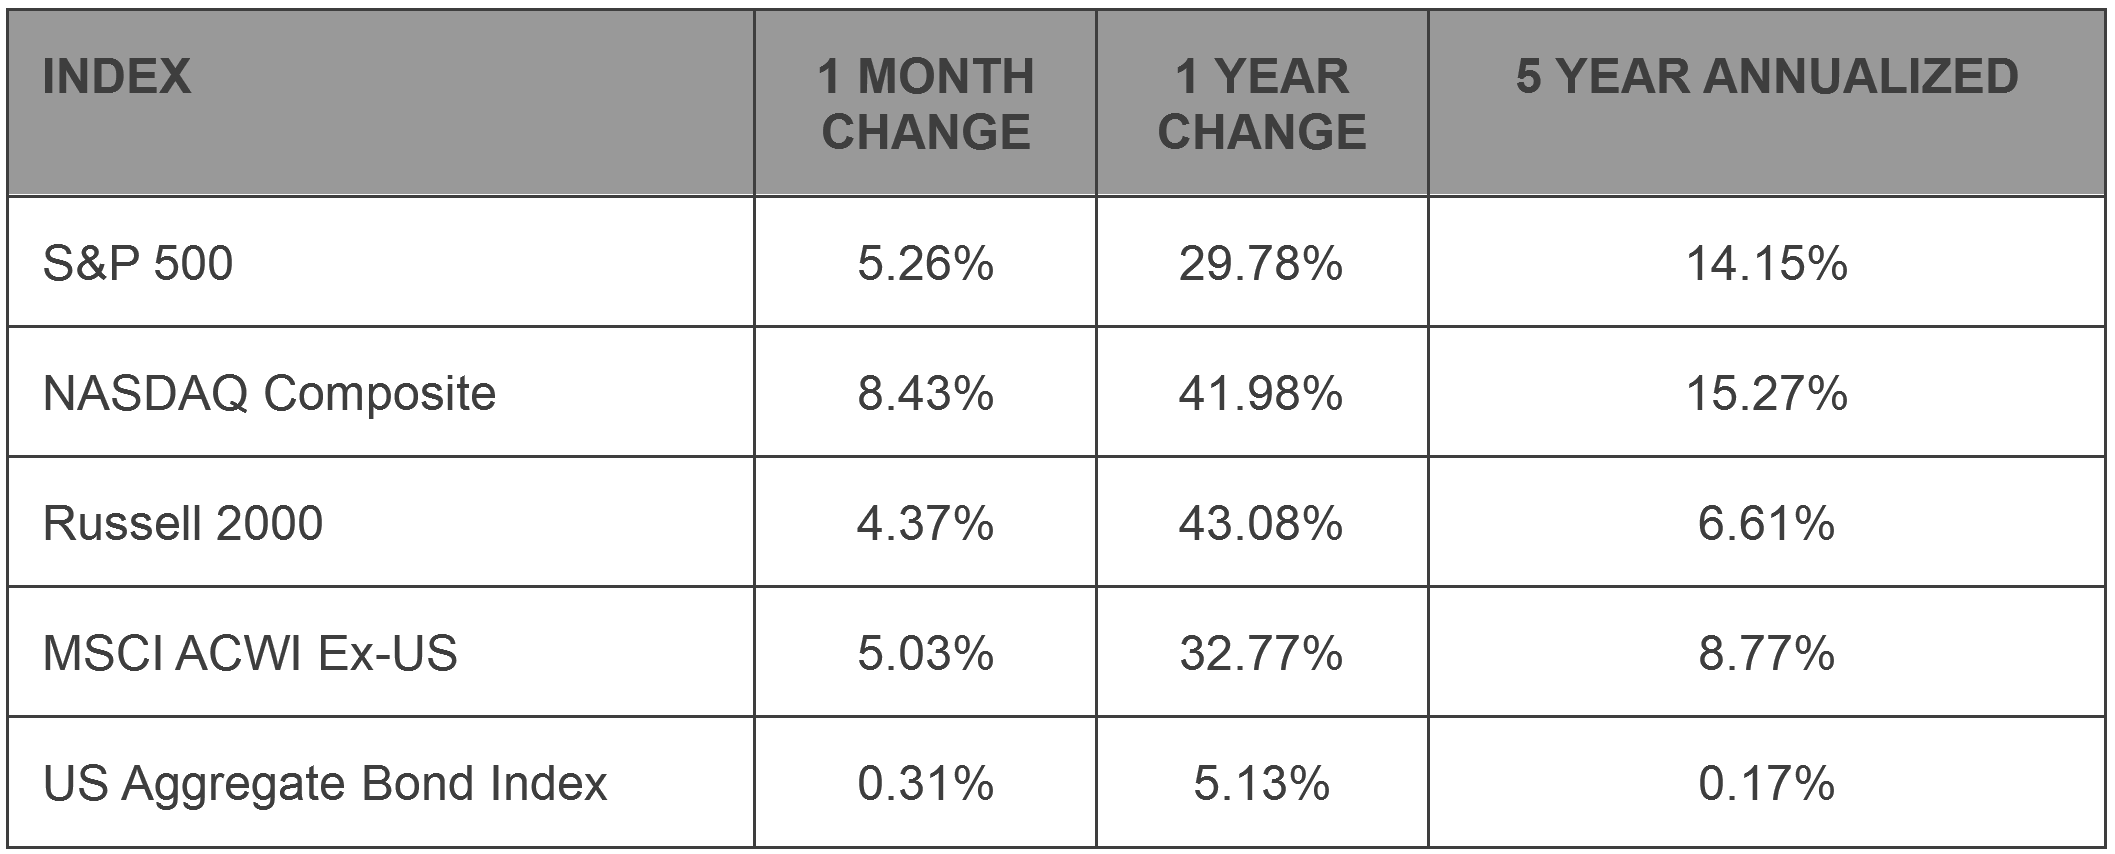
Stock prices continued to rally in May, brushing off concerns about an extended conflict in the Middle East and instead focusing on growth potential from AI innovations. The NASDAQ Composite – an index which boasts higher allocations to tech companies – led the way, rising more than 8% during the month.
It wasn’t just a US phenomenon, either. The MSCI ACWI ex-US Index rose 5% in May and has gained 14% in 2026, even better than the 11% year-to-date gain for the S&P 500. The Russell 2000 Index of small caps lagged somewhat in May, but it’s been the leader over the last 12 months, rising 43% over that period.
In fixed income, the 10-year US Treasury yield briefly rose to a 17-month high before dropping sharply to end the month of May. So far in 2026, the US Aggregate Bond Index has generated less than 1% of gains.
S&P 500 Sector Highlights
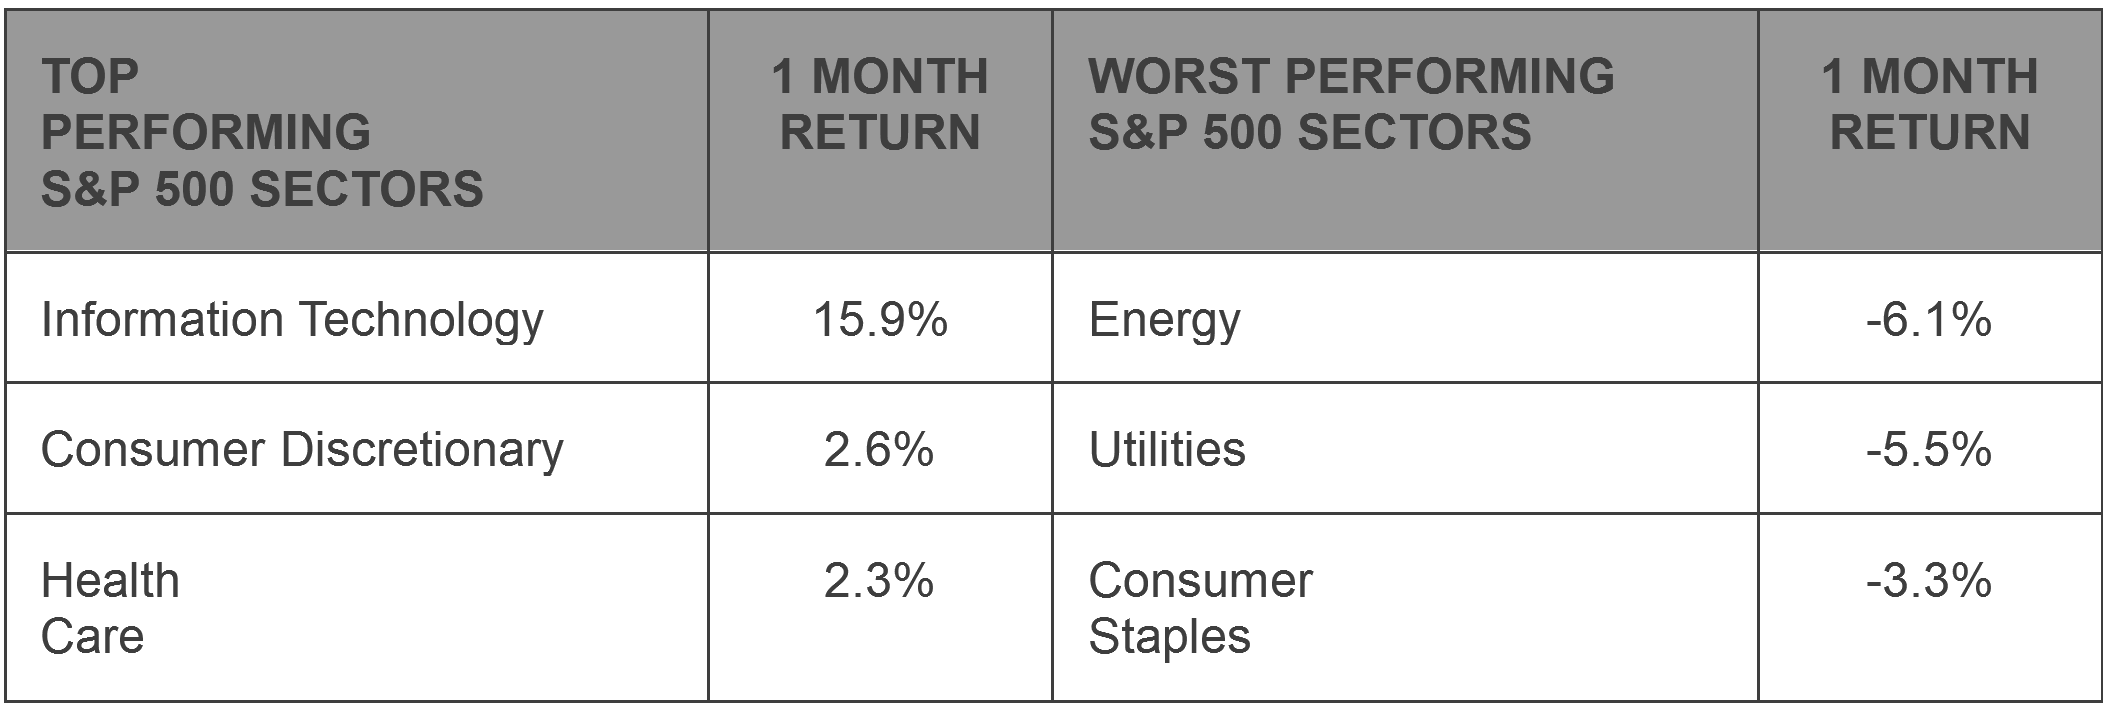
One S&P 500 sector was responsible for nearly all of the market gains in May. Information Technology rose 15.9% for the month, far outpacing that of every other market sector. In fact, Tech’s dominance was so extreme that no other sector even outperformed the S&P 500 over that period.
You read that right: 10 of the 11 S&P 500 sectors were below the average. And if that doesn’t sound possible, you’re thinking about it the right way.
The truth, though, is that while Tech’s leadership has been extreme, we can no longer call it ‘unusual’.
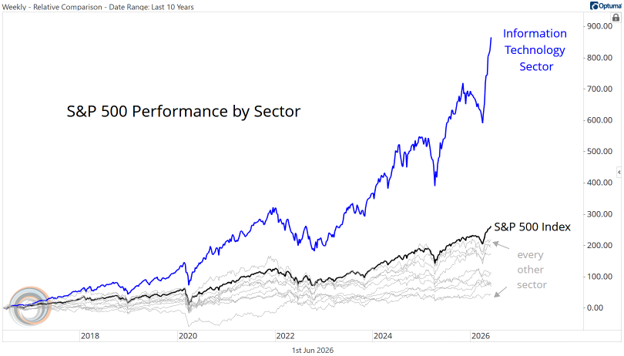
Here’s a performance derby of the S&P 500 sectors over the last decade. Over a 10-year period, a buy-and-hold strategy in any sector other than Tech would have resulted in underperforming the S&P 500. It’s a market anomaly that will almost certainly come to an end at some point, but has already persisted for far longer than most people expected.
What to Watch in June
6/5 - BLS Jobs Report – May
The labor market in April added 115,000 jobs, following a revised addition of 185,000 in March. For May, economists are looking for a modest gain of 85,000. Over the last 12 months, jobs growth has averaged about 27,000, just a fraction of the 122,000 added per month in 2024 and the 210,000 average from 2023. Still, the unemployment rate today is a mere 4.3%, well below the long-term average.
6/10 – Consumer Price Inflation - May
CPI was at 3.8% in April, up from 3.3% in March after surging oil prices caused inflation readings to surge. Core CPI, however, came in at just 2.8%. Policy makers are struggling to determine whether the stoppage of flows through the Strait of Hormuz is a transitory event for prices, or whether energy costs will lead to more widespread inflationary pressures. Without any resolution in the Middle East in May, economists believe CPI will surpass 4%.
6/17 – FOMC Interest Rate Decision
This will be Kevin Warsh’s first meeting as Chair of the Federal Reserve. Today, markets view any interest rate move as unlikely. Warsh may, however, leave his mark in other ways. He bemoaned the Fed’s use of forward guidance during confirmation hearings, which could mean changes to releases like the Summary of Economic Projections, or a reduction to the number of post-FOMC meeting press conferences.
6/25 – Q1 Gross Domestic Product – Final Estimate
Core GDP growth is slowing, but it remains healthy. The second estimate of Q1 GDP was revised from 2.0% to 1.6%, still an increase from the 0.5% growth in Q4 that was dragged lower by the government shutdown. The Q1 number featured larger-than-usual impacts from net exports (e.g. tariffs), but it was likely the ‘cleanest’ measure of GDP that we’ve gotten over the past year.
Market Wrap: Bubble Talk
Above, we shared a performance chart of the Information Technology sector compared to the rest of the S&P 500. If that chart made you feel uncomfortable about the current level of stock prices, you aren’t alone. Concerns about market concentration, elevated valuations, and irrational exuberance are popular in financial media today, and in many ways, quite valid.
For our part, we won’t be so bold as to predict a major market downturn. That’s a task better left to historians, rather than anyone living in the moment. But we will provide some context around all this ‘bubble’ talk.
There are certainly parallels today to the Dotcom era of the late 1990s. A transformational technology with nearly unlimited potential. Market prices that seem to climb higher and higher with each passing day. Billionaire CEOs dancing on stage at company events (ok, that one’s a little obscure, but if you haven’t seen Bill Gates and Steve Ballmer grooving on stage at the launch of Windows 95, it’s worth your time. NVIDIA CEO Jensen Huang showed off his moves at a recent event in Taiwan).
Weak market breadth is perhaps the most pressing concern. The concept of breadth is pretty simple: the more stocks that participate in a trend, the stronger that trend is. Right now, though, we’re seeing fewer and fewer stocks participating.
Below is the percentage of S&P 500 stocks that are trading above their 200-day moving average price – in other words, it’s the percentage of stocks that are trending higher over time. The S&P 500 index as a whole continues to rise, but beneath the surface, fewer and fewer stocks are doing so.
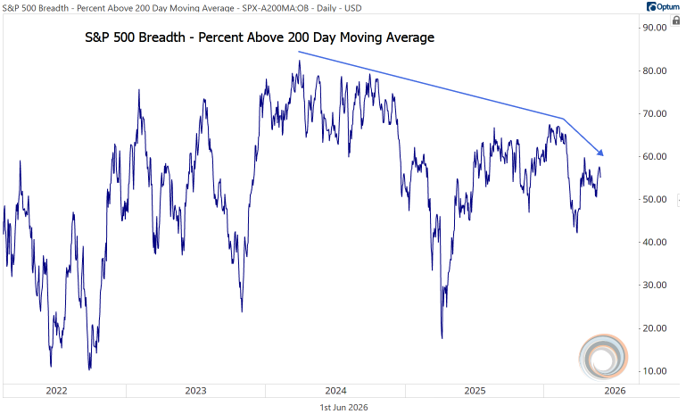
A lack of breadth confirmation isn’t a death knell for markets. It can generally be corrected in one of two ways: either the laggards catch up, or the leaders catch down. And in the opinion of many stock market bulls, it’s hard to imagine the leaders catching down.
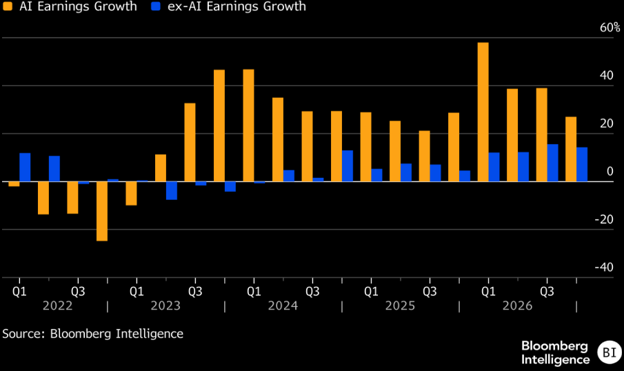
That’s because one of the biggest differences between today’s market and that of the Dotcom era is underlying business health. In the 1990s, stocks were surging primarily on investor sentiment, or the valuations component of the stock price. In contrast, today’s rising prices are more reflective of actual revenues and earnings. AI-related companies grew earnings at a rate of nearly 60% in Q1, far outpacing growth for non-AI companies. That goes a long way in explaining why the bulk of market gains are coming from just a few dozen tech stocks.
Bureau of Economic Analysis: https://www.bea.gov/data/gdp/gross-domestic-product
Bureau of Labor Statistics: https://www.bls.gov/
US Census Bureau: https://www.census.gov/retail/sales.html
Federal Reserve: https://www.federalreserve.gov/
New York Federal Reserve: https://www.newyorkfed.org/microeconomics/hhdc
Market performance data sourced from Bloomberg Finance L.P. and Optuma
Disclosures:
Content in this material is for general information only and not intended to provide specific advice or recommendations for any individual. All performance referenced is historical and is no guarantee of future results. All indices are unmanaged and may not be invested into directly.
The Standard & Poor’s 500 Index is a capitalization weighted index of 500 stocks designed to measure performance of the broad domestic economy through changes in the aggregate market value of 500 stocks representing all major industries.
The NASDAQ Composite Index measures all NASDAQ domestic and non-U.S. based common stocks listed on The NASDAQ Stock Market. The market value, the last sale price multiplied by total shares outstanding, is calculated throughout the trading day, and is related to the total value of the Index.
The Russell 2000 Index is an unmanaged index generally representative of the 2,000 smallest companies in the Russell 3000 index, which represents approximately 10% of the total market capitalization of the Russell 3000 Index.
The Bloomberg U.S. Aggregate Bond Index is an index of the U.S. investment-grade fixed-rate bond market, including both government and corporate bonds.
The MSCI ACWI ex USA Index captures large and mid cap representation across Developed Markets (DM) countries (excluding the US) and Emerging Markets (EM) countries. The index covers approximately 85% of the global equity opportunity set outside the US.