Adios, Jerome: Convergence Commentary - April 2026
Quick Hits
Fed change: Jerome Powell out; Kevin Warsh in.
Rate uncertainty: Fed split as growth vs. inflation risks clash.
Markets rebound: Stocks up (led by growth); yields rising.
Market-Moving Highlights
After 8 years at the helm, Jerome Powell’s second term as Chair of the Federal Reserve will come to an end later this month. He’s set to be replaced by Kevin Warsh, whose path to confirmation was cleared when the DOJ dropped its criminal investigation into Powell over cost overruns related to the renovation of its Washington D.C. headquarters. Republican Senator Thom Thillis had vowed to vote against any nominee until the investigation was ended.
Warsh will take over at a time when there’s little consensus on the right path for monetary policy. The FOMC kept interest rates unchanged last week, but four members dissented. Stephen Miran again voted to lower rates by 0.25%, while Beth Hammack, Neel Kashkari, and Lorie Logan, who each supported the no-cut decision, did not support the inclusion of an easing bias in the statement.
The three hawkish dissenters seem wary of the ongoing oil crisis and the risk it poses to price stability. In their view, the future is so ripe with uncertainty that guiding toward any course of action would be inappropriate. Rather, they’d prefer to keep all options on the table – including both increases and decreases to the target federal funds rate.
To their point, the economic data fails to paint a clear picture.
On the one hand, GDP in Q1 rose 2%. driven by healthy growth in both consumption and investment. The labor market, too, is showing signs of stabilization. Continuing jobless claims in the United States have dropped sharply since October and are at their lowest level in nearly 2 years.
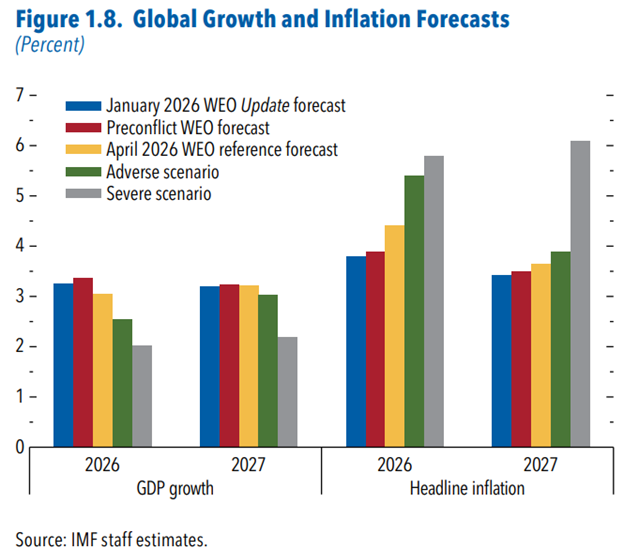
On the other hand, higher oil prices tend to dramatically impact consumer spending in other areas of the economy, which can lead to a broad-based slowing in economic growth. The chart below details changes in global growth and inflation estimates from the IMF – both are trending counter to the Fed’s goals.
Index Performance
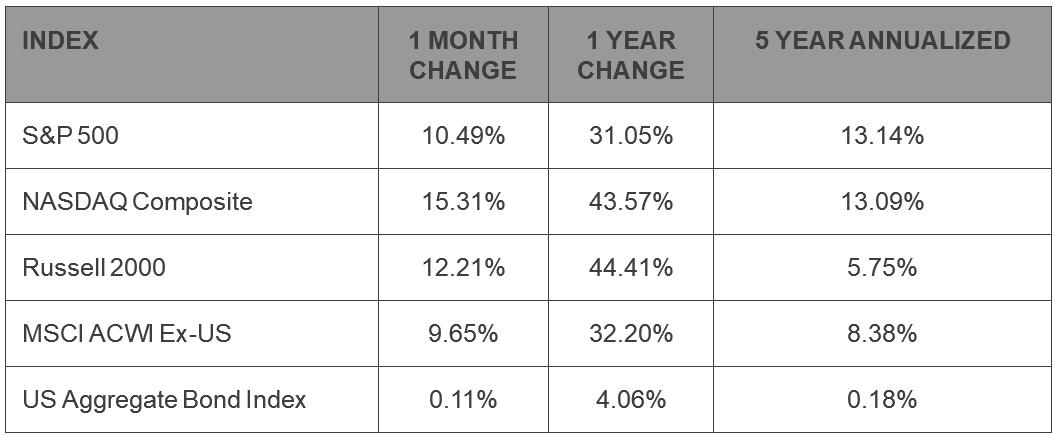
After dropping in Q1, stock prices rebounded in April on hopes that the Middle East conflict is nearing a resolution. Large cap growth stocks, which led the way lower through the first three months of the year, were the best performers last month: the NASDAQ Composite rose 15.3%.
The Russell 2000 Index of small caps remains the year-to-date leader, however. That index has gained 13% for the year, more than double the gain for the S&P 500.
International equities rebounded as well. The MSCI ACWI ex-US Index jumped nearly 10% for the month and has outperformed both the S&P 500 and the NASDAQ Composite in 2026.
In fixed income, long-term rates are on the rise. Yields on 30-year Treasuries just logged their highest monthly close since 2023 and second-highest since 2007.
S&P 500 Sector Highlights
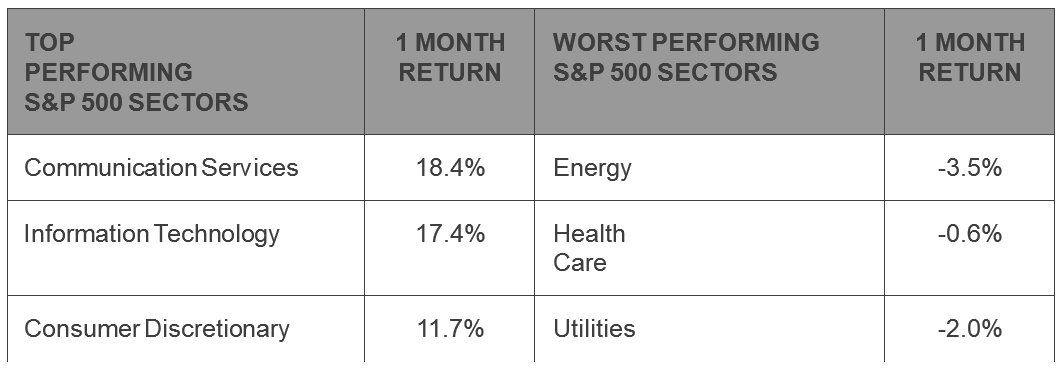
Three S&P 500 sectors – Communication Services, Information Technology, and Consumer Discretionary – are home to each of the Magnificent 7 stocks that have dominated US markets in recent years. Those 3 sectors are largely comprised of ‘growth’ stocks, as opposed to the ‘value’ stocks that make up the bulk of sectors like Industrials, Financials, and Energy. It was growth stocks that benefited most from the rebound. As such, the growth sectors all climbed double digits in April.
Energy stocks faltered, with the sector falling 3.5% in April. For all of 2026, however, they’re still up more than 30%. That performance discrepancy is common in today’s market landscape. Despite their huge April rallies, Communication Services, Information Technology, and Consumer Discretionary are ranked 6th, 8th, and 9th, out of 11, in terms of year-to-date sector performance.
What to Watch in May
5/8 - BLS Jobs Report – April
The labor market in March added 178,000 jobs, following a revised loss of 133,000 in February. For April, economists are looking for a modest gain of 65,000. Over the last 12 months, jobs growth has averaged about 22,000, just a fraction of the 122,000 added per month in 2024 and the 210,000 average from 2023. Still, the unemployment rate today is a mere 4.3%, well below the long-term average.
5/12 – Consumer Price Inflation - April
CPI was at 3.3% in March, up from 2.4% in February after surging oil prices caused inflation readings to surge. Core CPI, however, came in at just 2.6%. Policy makers are struggling to determine whether the stoppage of flows through the Strait of Hormuz is a transitory event for prices, or whether energy costs will lead to more widespread inflationary pressures.
5/15 – Powell’s Term as Chair of the Fed Ends
Jerome Powell’s term as Chair of the Fed ends, so long as Kevin Warsh is confirmed by that date. Notably, Powell has eschewed tradition and will stay on in his role as a Federal Reserve governor, where his term doesn’t end until 2028. That decision was driven by the DOJ’s investigation, which Powell wants to see ‘fully and transparently resolved.’
5/28 – Q1 Gross Domestic Product
Core GDP growth is slowing, but it remains healthy. The first estimate of Q1 GDP came in at 2.0%, an increase from the 0.5% growth in Q4 that was dragged lower by the government shutdown. The Q1 number still featured larger-than-usual impacts from net exports (e.g. tariffs), but it was likely the ‘cleanest’ measure of GDP that we’ve gotten over the past year.
Market Wrap
If you’re having trouble keeping up with the latest headlines out of the Middle East, you’re hardly alone. News flow about potential deals, ceasefire breaches, and ship seizures seems to change with each hour. Here were just some of the key developments over the past month:
On April 7, President Trump announced a two-week ceasefire which was confirmed by Iran’s National Security Council. Within 24 hours, Iran accused Israel of violating that agreement after strikes against Hezbollah forces in Lebanon.
On April 11, Vice President JD Vance and other negotiators traveled to Islamabad for peace talks, brokered by Pakistan. Those talks ended without an agreement after the parties failed to compromise on key points like Iran’s uranium stocks and reopening the Strait of Hormuz.
On April 12, Trump announced a US naval blockade of the Strait to prevent Iranian-linked vessels from leaving.
About a week later, on April 17, the United States and Iran released statements declaring the Strait of Hormuz open to commercial vessels. Once again, it took less than 24 hours for things to change. Iran abruptly closed the waterway and maritime officials recorded two incidents of vessels being hit. American military forces responded by seizing an Iranian cargo ship later that weekend.
With the initial ceasefire agreement just hours away from expiration on April 21, President Trump announced that he was extending it, citing a lack of centralized leadership in Tehran that was stalling negotiations.
Then on the 25th, Trump was forced to cancel a trip by some of his top negotiators who had planned to travel to Pakistan for peace talks after Iranian leadership failed to commit to the meeting. In the days since, Iran has proposed coming to a more targeted agreement that doesn’t address their nuclear ambitions but would open the Strait and end the US blockade.
In short, the conflict continues and the outcome is nearly impossible to predict.
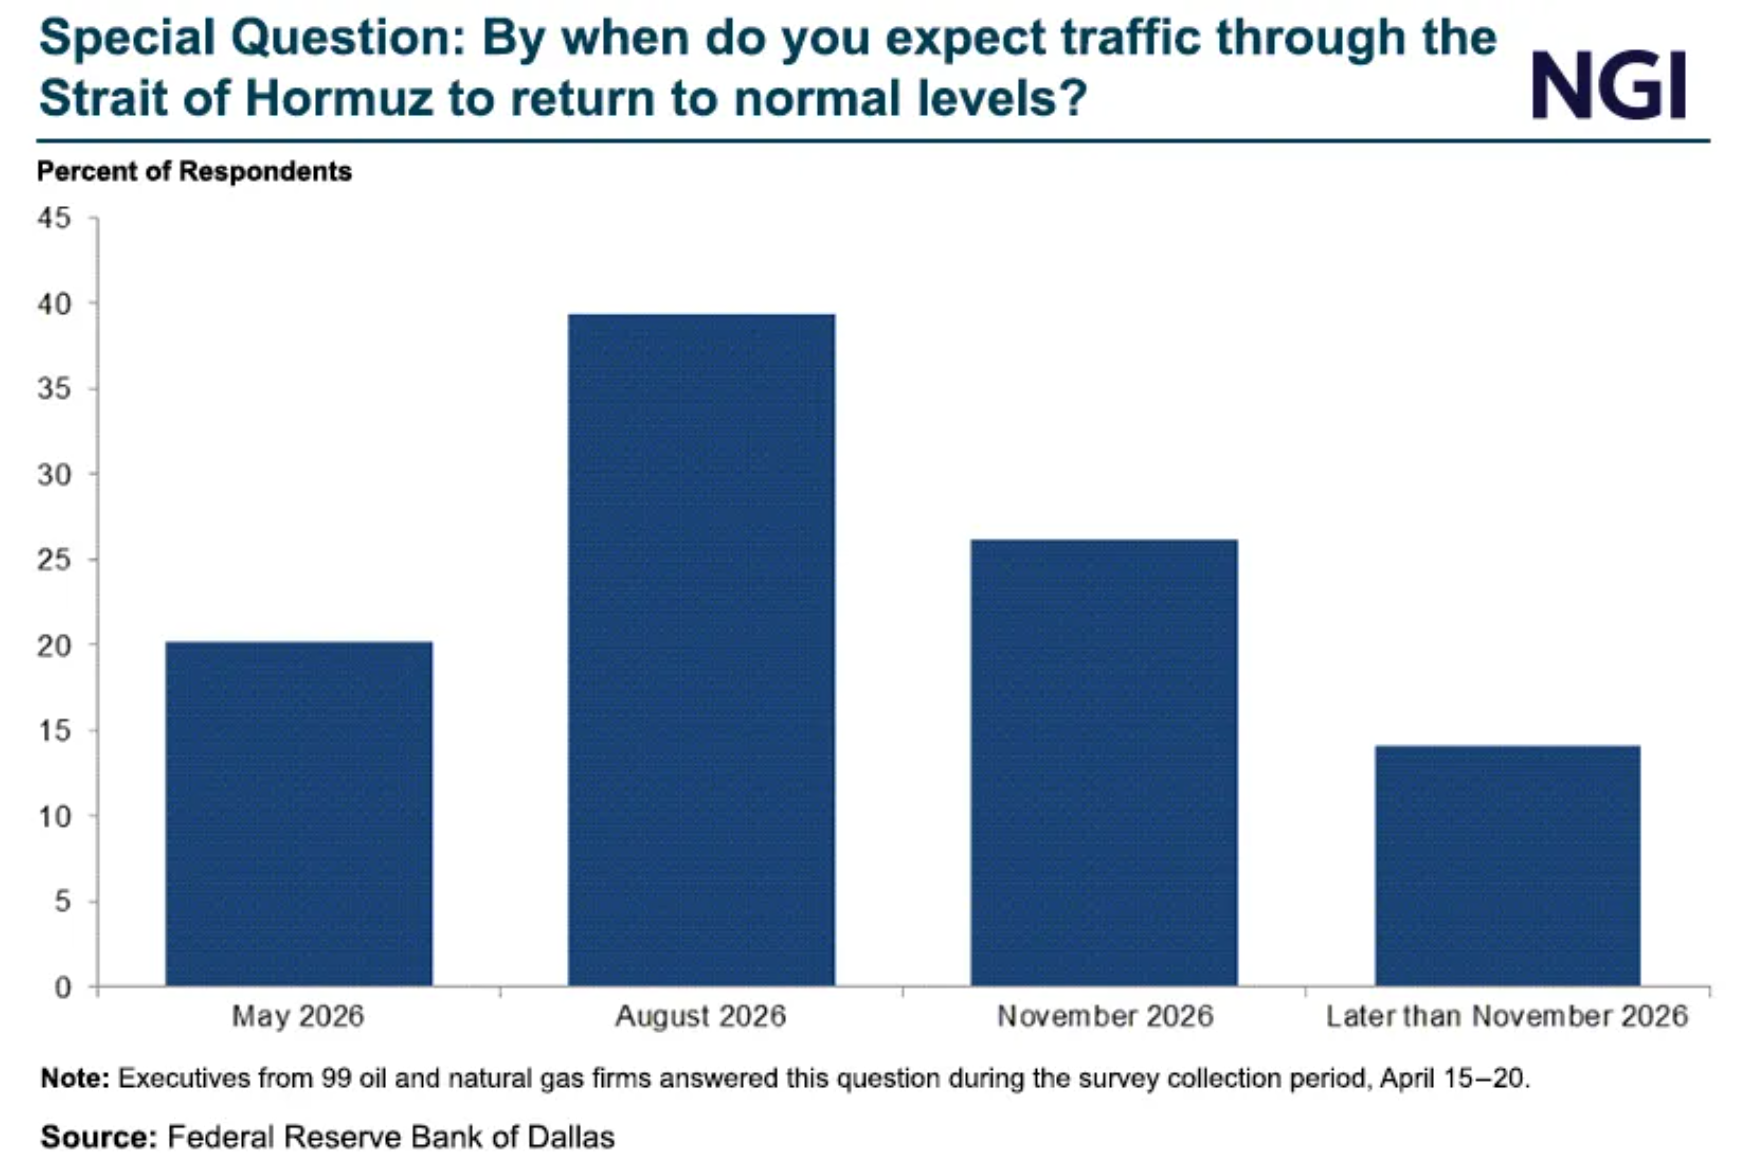
For their part, business executives don’t appear optimistic about a deal that will fix the oil supply problem any time soon. In a survey from the Federal Reserve Bank of Dallas, just 20% saw flows through the Strait of Hormuz normalizing within the next month. About 40% expected disruption to continue until November or later.
Bureau of Economic Analysis: https://www.bea.gov/data/gdp/gross-domestic-product
Bureau of Labor Statistics: https://www.bls.gov/
US Census Bureau: https://www.census.gov/retail/sales.html
Federal Reserve: https://www.federalreserve.gov/
New York Federal Reserve: https://www.newyorkfed.org/microeconomics/hhdc
Market performance data sourced from Bloomberg Finance L.P. and Optuma
Disclosures:
Content in this material is for general information only and not intended to provide specific advice or recommendations for any individual. All performance referenced is historical and is no guarantee of future results. All indices are unmanaged and may not be invested into directly.
The Standard & Poor’s 500 Index is a capitalization weighted index of 500 stocks designed to measure performance of the broad domestic economy through changes in the aggregate market value of 500 stocks representing all major industries.
The NASDAQ Composite Index measures all NASDAQ domestic and non-U.S. based common stocks listed on The NASDAQ Stock Market. The market value, the last sale price multiplied by total shares outstanding, is calculated throughout the trading day, and is related to the total value of the Index.
The Russell 2000 Index is an unmanaged index generally representative of the 2,000 smallest companies in the Russell 3000 index, which represents approximately 10% of the total market capitalization of the Russell 3000 Index.
The Bloomberg U.S. Aggregate Bond Index is an index of the U.S. investment-grade fixed-rate bond market, including both government and corporate bonds.
The MSCI ACWI ex USA Index captures large and mid cap representation across Developed Markets (DM) countries (excluding the US) and Emerging Markets (EM) countries. The index covers approximately 85% of the global equity opportunity set outside the US.
Precious metal investing involves greater fluctuation and potential for losses.