Will Oil Drive Inflation?: Convergence Commentary - March 2026
Quick Hits
Oil spike from Iran conflict driving inflation fears
Stocks fell -5% broadly; energy surged
Earnings still rising despite market decline
Market-Moving Highlights
War with Iran is driving the news headlines, and in March, it drove markets, too. Oil prices have become a global focal point. The effective closure of the Strait of Hormuz has caused an energy supply crunch that’s set to spread from Asia to the western world over the coming weeks.
Thanks to domestic production, the United States is among the most insulated countries when it comes to supply issues. That doesn’t mean US consumers aren’t feeling the impact of higher prices, though. With WTI oil trading at more than $100 per barrel – and Brent, the global oil benchmark, even higher - Morgan Stanley believes the energy price shock will more than offset the stimulative effects the One Big Beautiful Bill Act is having on personal consumption in 2026.
Taking the other side of these rather pessimistic views is Torsten Slok, Chief Economist at Apollo Global:
Markets are overreacting to what will likely be a 4- to 6-week period of volatility, which will ultimately result in 50 years of stability in oil markets, supply chains and geopolitics.
Monetary policymakers are struggling to digest these varying views. On the one hand, higher energy costs drive up prices across the economic landscape, threatening price stability goals. On the other, sky-high energy costs erode buying power and can stall economic activity. The Federal Reserve, Bank of England, Bank of Japan, and European Central Bank, among others, are all left asking: Should rates be higher to keep inflation from running rampant again, or should rates be lower to protect against an economic downturn?
For now, it seems they’re leaning towards the former. The Bank of England last month surprised markets with a unanimous decision to leave rates unchanged - laying the groundwork for rate hikes later this year. Governor Kazuo Ueda similarly signaled that the Bank of Japan was shifting away from a focus on downside risks to the economy.
Fed Chair Jerome Powell didn’t commit to any course of action after last month’s decision to keep policy steady, but that doesn’t mean markets aren’t trying to parse out the bank’s next move. Just over a month ago, December federal funds futures were pricing in as many as 3 quarter-point interest rate cuts for 2026. Today, all those implied cuts have evaporated.
Index Performance
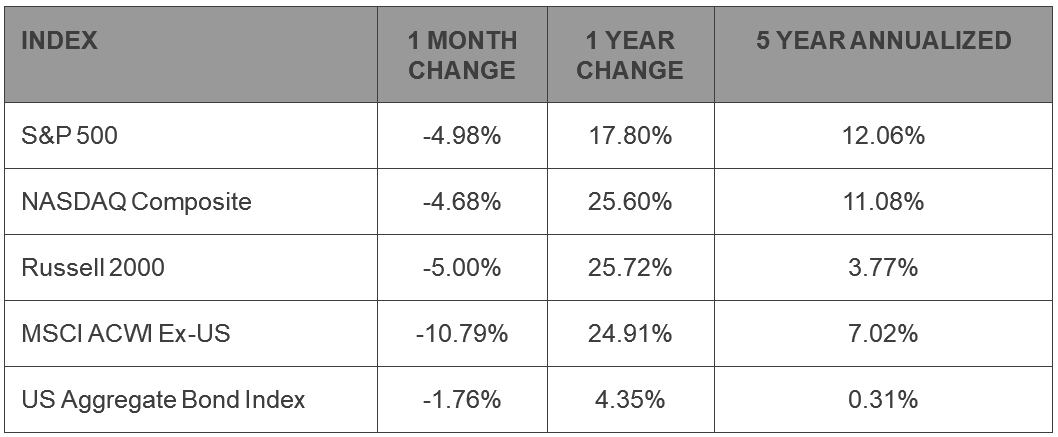
US stock prices fell 5% in March.
Usually, it’s necessary to qualify a statement like that. Was it large caps that fell 5%? Small caps? Growth stocks? Value? In this case, it was all of them. For each the S&P 500, the S&P 500 Growth and Value Indices, the NASDAQ Composite, the Dow Jones Industrial Average, and the Russell 2000 Index of small caps, the decline in March was between 4.5% and 5.5%.
When markets are rising, leadership tends to rotate – one group of stocks does best one month, another group the next. But in market downturns, correlations often move to 1.
There’s still a wide divergence in performance for the year. The S&P 500 Index has fallen 4.3% in 2026, but its Value component is flat. Growth has dropped 8%. International stocks took the brunt of the selling in March, falling more than 10%, but they’re down just 1% for the year. And the Russell 2000? It’s still in positive territory. If and when markets stabilize, it will be interesting to see whether that leadership from value stocks emerges again.
S&P 500 Sector Highlights
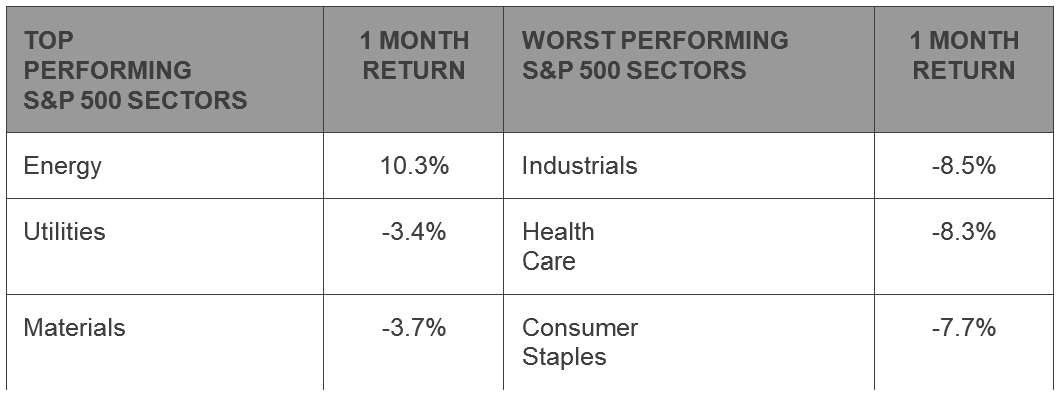
Only one sector was positive in March, which should come as little surprise given the breadth of the selloff. Energy stocks, thanks to surging oil prices, rose 10%. The Utilities sector, often heralded as a relative safe haven for investors, fell only 3.4% for the month, while the Financials also outperformed. For the Financials, though, March was little respite – it’s still the worst performing sector on a year-to-date basis.
The Industrials and Health Care sectors both reverted to the middle of the pack for 2026 after declining more than 8% for the month. The Consumer Staples also dropped more than the average. For Staples, which often outperform during down markets due to their reputation for earnings stability, the decline was likely a reflection on inflation concerns. Consumer Staples companies tend to have low margins and little pricing power. That can make it difficult to absorb an energy price shock.
What to Watch in April
4/3 - BLS Jobs Report – March
The labor market in February lost 92,000 jobs. That was the sixth negative print over the last year and among the lowest since the onset of the COVID crisis in 2020. For March, the consensus estimate implies that jobs growth will return with a modest 65,000 gain.
4/10 – Consumer Price Inflation - March
CPI was at 2.4% in February, not far from the Fed’s price stability goal of 2%. In March, economists expect that number to ballon to 3.4%, driven by the surge in energy prices. Core inflation, which strips out the impacts of food and energy, is expected to be a more modest 2.7%, up from 2.5% the prior month.
4/29 – FOMC Rate Decision
The Federal Reserve meets again to decide the appropriate level of interest rates. In March, the Fed left interest rates unchanged, deferring a decision until the cloud of uncertainty around oil prices dissipates. There’s seemingly no predilection to move rates one way or the other. When pressed about the rate forecasts published in the Fed’s Quarterly Summary of Economic Projections, Chair Jerome Powell had this to say:
“So I wouldn’t say there’s a conviction that this is going to go through quickly, or not quickly, it just—you’ve got to write something down.”
4/30 – Q1 Gross Domestic Product
Maybe this is the GDP report we’ve been looking for? We’ve often lamented that the pull-forward of imports in Q1 2025 skewed the calculation of GDP for the next two quarters. Then, after the longest government shutdown in US history, government spending in Q4 fell by the most since 1972, once again skewing the data. Perhaps in Q1 we’ll see a return to normalcy in the data. Or perhaps not.
Market Wrap
The AI revolution spurred a huge capex cycle that fueled low-teens earnings growth for the S&P 500 index in 2025 and is expected to drive similar levels of growth in 2026 and 2027. There’s plenty of uncertainty surrounding the sustainability of hyperscaler capacity buildout, but analysts are getting more and more comfortable with companies’ own lofty projections – in spite of the ongoing war with Iran and a sharp market correction.
Why do we care about earnings so much? We know that over short-term time horizons, news headlines and investor sentiment drive market swings. But over the long-term, earnings are what matter. So the current divergence between price and earnings is worth keeping an eye.
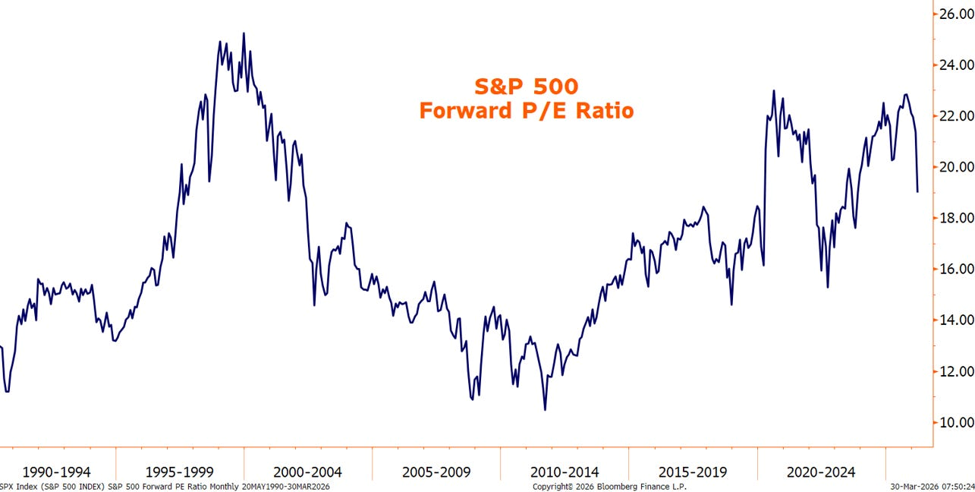
The S&P 500 peaked at the end of January and has fallen as much as 9% from those highs. Forward earnings for the index, however, aren’t having the same response. It’s true that Wall Street analysts are usually behind the curve, failing to adjust earnings downward at a fast enough pace to match a crisis that’s unfolding in real-time. That’s not what’s happening here, though. Analysts aren’t cutting earnings estimates too slowly. They’re raising them. Forward earnings for the S&P 500 are 6% higher than they were at the end of January.
That’s helped drive the price-to-earnings multiple for the large cap index from a lofty 23x to just 19x over the course of a few weeks.
Bureau of Economic Analysis: https://www.bea.gov/data/gdp/gross-domestic-product
Bureau of Labor Statistics: https://www.bls.gov/
US Census Bureau: https://www.census.gov/retail/sales.html
Federal Reserve: https://www.federalreserve.gov/
New York Federal Reserve: https://www.newyorkfed.org/microeconomics/hhdc
Market performance data sourced from Bloomberg Finance L.P. and Optuma
Disclosures:
Content in this material is for general information only and not intended to provide specific advice or recommendations for any individual. All performance referenced is historical and is no guarantee of future results. All indices are unmanaged and may not be invested into directly.
The Standard & Poor’s 500 Index is a capitalization weighted index of 500 stocks designed to measure performance of the broad domestic economy through changes in the aggregate market value of 500 stocks representing all major industries.
The NASDAQ Composite Index measures all NASDAQ domestic and non-U.S. based common stocks listed on The NASDAQ Stock Market. The market value, the last sale price multiplied by total shares outstanding, is calculated throughout the trading day, and is related to the total value of the Index.
The Russell 2000 Index is an unmanaged index generally representative of the 2,000 smallest companies in the Russell 3000 index, which represents approximately 10% of the total market capitalization of the Russell 3000 Index.
The Bloomberg U.S. Aggregate Bond Index is an index of the U.S. investment-grade fixed-rate bond market, including both government and corporate bonds.
The MSCI ACWI ex USA Index captures large and mid cap representation across Developed Markets (DM) countries (excluding the US) and Emerging Markets (EM) countries. The index covers approximately 85% of the global equity opportunity set outside the US.
Precious metal investing involves greater fluctuation and potential for losses.