Quick Hits
Treasury battles bond market rate spikes
Stocks hit new highs; earnings strong
Fed hints at possible rate hikes
Market-Moving Highlights
On August 18, the interest rate on 30-year US Treasury bonds rose to more than 5.3%, reaching a level last seen in the summer of 2007. Just a day later, the US Treasury Department unveiled a plan to increase the size of ‘nominal long-end liquidity support buybacks’ to at least $4 billion per operation.
In short, Treasury Secretary Scott Bessent is taking on the bond market.
It wasn’t the first time Bessent has acted to keep interest rates from soaring. On July 31, he and Japanese policymakers teamed up to strengthen the Japanese yen, which had fallen to near-40-year lows relative to the US Dollar. Bessent defended the move, arguing that a weak yen could trigger a chain of currency devaluations and fuel global financial stability risks. Left unsaid was that Japan is a major holder of US debt, and further yen weakness could force them to sell that debt, pushing US borrowing costs higher.
The latest action, increasing the size of liquidity support buybacks, is another installment of ‘Operation Twist’, where long-dated bonds are bought and paid for by issuing shorter-term debt. The goal is to lower interest rates at the long end of the yield curve. Similar ‘Twist’ operations took place in the early 1960s and 2011, though this time it’s the Treasury leading the effort instead of the Federal Reserve.
Bessent’s opponent in this bond market battle is the ‘bond vigilantes’, a term coined by economist Ed Yardeni back in the 1980s to describe the bond market’s response to irresponsible fiscal or monetary policy. The bond vigilantes have been quiet for most of the last two decades, subdued by central bank policies around the world that have kept rates pegged at historically low levels. But in the face of higher global inflation, those same central banks have been forced to take a step back from their loose policy measures, allowing the bond vigilantes to come out of hiding.
According to Dr. Yardeni, the bond market today is responding to an array of risks. Among the most pressing? The US Federal Debt just surpassed $40 trillion, and the annual fiscal deficit is rising. Meanwhile, corporate bond issuance is ramping up as mega cap tech companies borrow to build new artificial intelligence compute capacity.
The bond market is being flooded with all this new supply at a time when investors are growing more wary of fixed income, given ongoing inflationary pressures from war in the Middle East, tariffs, and AI shocks. That’s all helping to drive government borrowing costs higher, which has put the Treasury department and others in the administration on edge.
Treasury Secretary Scott Bessent swings a big stick – even threatening to use the trillion dollar Treasury General Account to support his liquidity buyback plan – but if he plans on controlling the bond market, he most certainly has his work cut out for him.
Index Performance
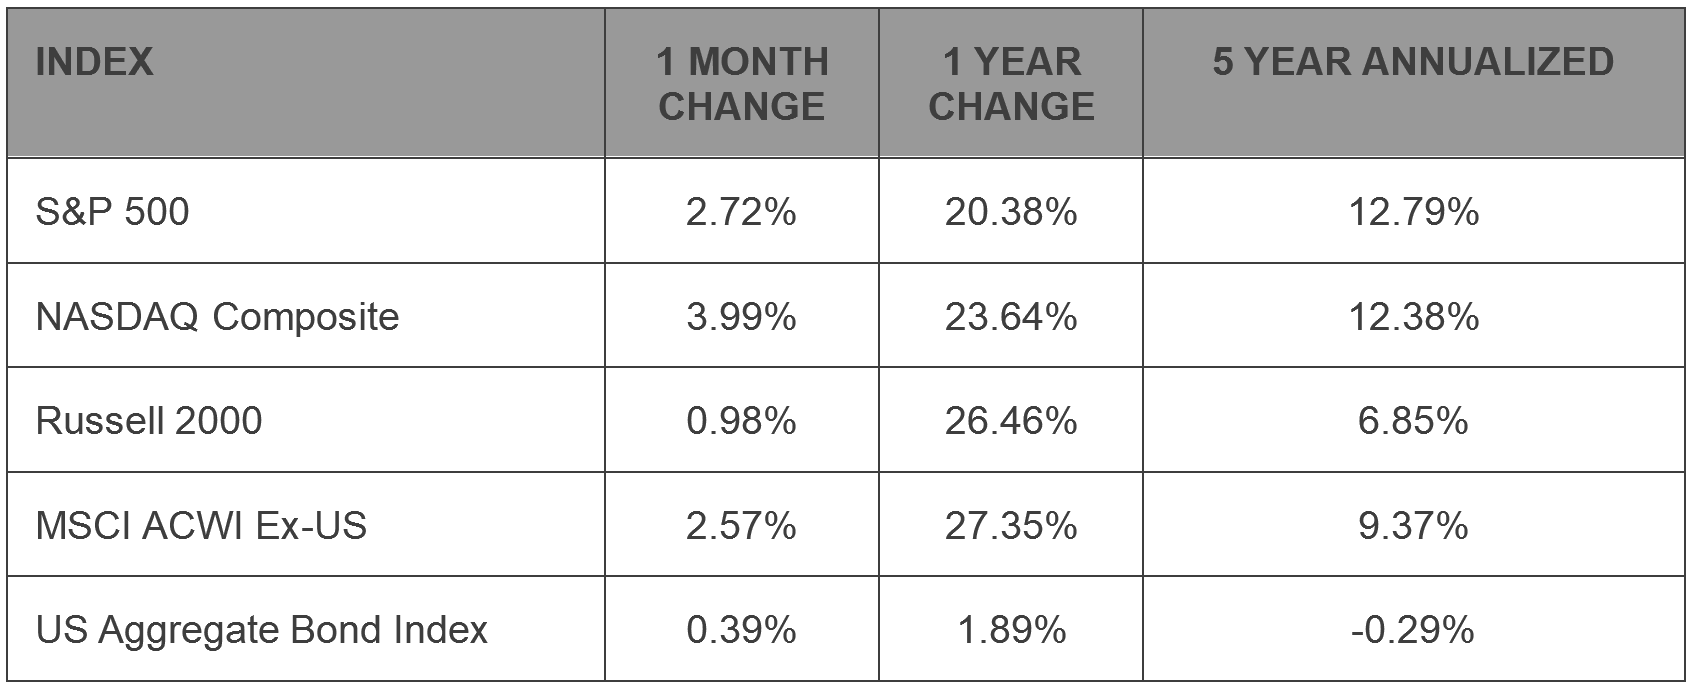
Stock prices rose in August, and the S&P 500 set a new all-time high during the month for the first time since early June. Large cap growth stocks led the charge, as evidenced by the 4% gain for the NASDAQ Composite. Gains for small caps were more modest, but still healthy: the Russell 2000 index rose just 1%. For the year, the S&P 500 is already on track for an above average year, up more than 13%. Strong as the rally has been, it pales in comparison to the fundamental improvement for the index in 2026. S&P 500 earnings are expected to grow 31% this year according to FactSet.
Moving away from US equities, the MSCI ACWI ex-US Index rebounded 2.6% in August after two consecutive monthly declines. International stocks are still outperforming the S&P 500 and the NASDAQ Composite on a year-to-date basis.
In fixed income, the 10-year US Treasury yield was largely unchanged for the month. It’s been a choppy year for bonds, but so far in 2026, the US Aggregate Bond Index has not generated meaningful returns for investors. They’ve been a drag over the past five year period as well.
S&P 500 Sector Highlights
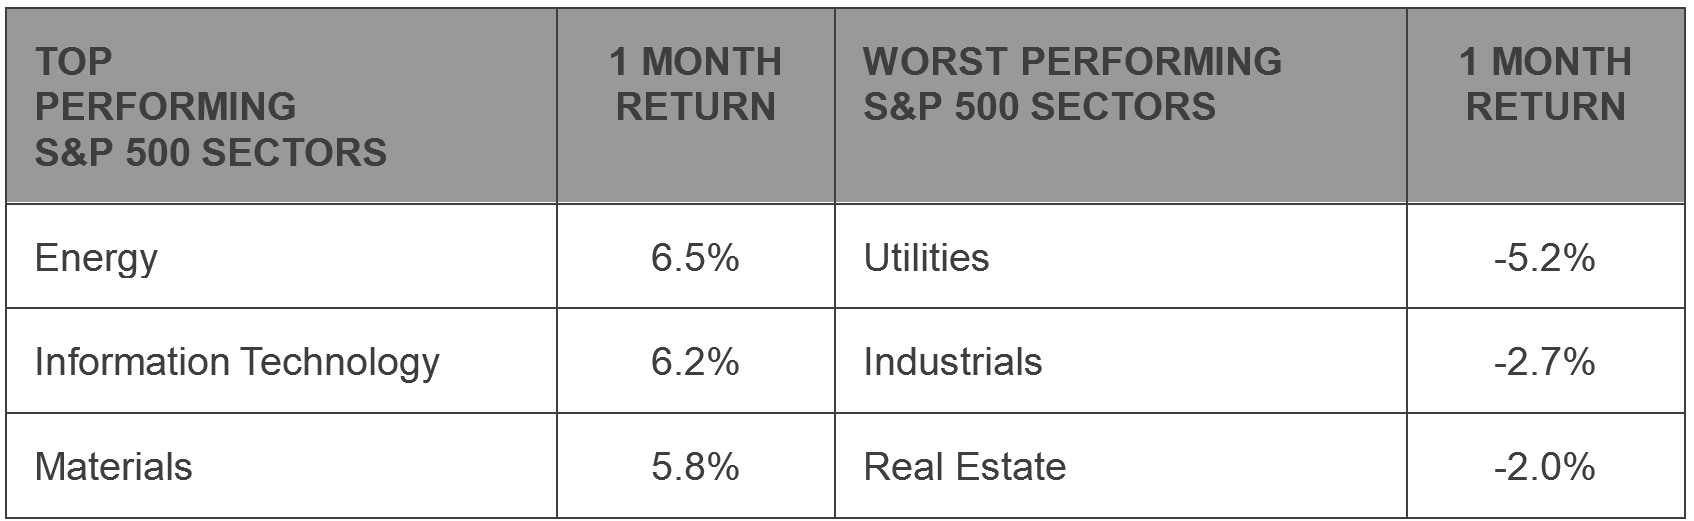
Energy stocks once again led US equities in August, rising another 6.5% after double digit gains in July. Renewed tensions between the US and Iran have WTI oil prices once again trading near $90 per barrel, which has the sector on track for earnings growth north of 80% this year, according to FactSet data. The Information Technology sector rebounded more than 6% during the month after chipmaker volatility pushed the sector down 3.5% in July.
On the downside, the Utilities dropped 5% in August, driven in part by California legislation that failed to include wildfire liability protections for utility companies. The sector closed at its lowest monthly level since last September.
What to Watch in September
9/4 - BLS Jobs Report – August
The jobs market lost 23,000 jobs in July, adding to a string of weak labor market reports. Perhaps ‘weak’ is the wrong word. Mixed? The headline numbers certainly haven’t been great. JOLTS job openings have dropped marked since April, and in addition to the weak July print, payroll adds for the prior two months were revised down by 103,000.
Despite that, the unemployment rate dropped from 4.2% in June to 4.1% in July. That matches the lowest jobless rate since early 2025.
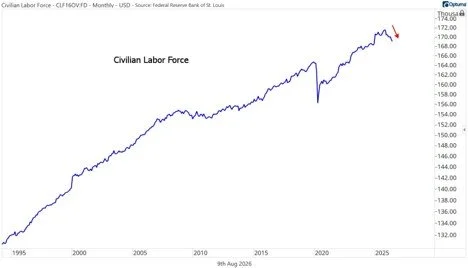
Why the mismatch between payroll additions and the unemployment rate? Quite simply, there are fewer workers today than there were a year ago. Excluding the COVID shock, the labor force decline over the past several months is the largest in more than 70 years.
9/11 – Consumer Price Inflation - August
Headline CPI drifted lower for the second straight month in July, with oil prices offering a brief respite to consumers. Still, at 3.4%, inflation is well above where it started and year, and higher still above the Fed’s 2% annual target.
9/16 – FOMC Interest Rate Decision
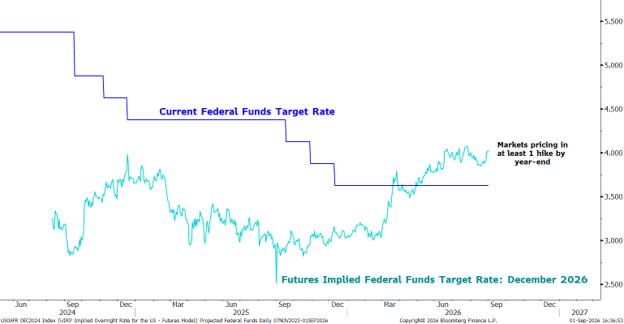
The new, Kevin Warsh-led Fed will meet again to determine the path of interest rate policy. Warsh isn’t much for giving forward guidance, believing the uncertainty gives the Fed more flexibility and an unfiltered look at financial market responses to economic data. Based on his remarks at Jackson Hole and current federal funds futures prices, however, it seems an interest rate hike is more likely than a cut at this month’s meeting.
9/30 – Q2 Gross Domestic Product – Final Estimate
The second estimate of Q2 GDP came in at 1.5%, down from 2.1% in Q1. The deceleration isn’t as bad as it looks. Net exports, which continues to be a volatile component thanks to uncertain tariff policies, was a drag on growth. But personal consumption, the largest component of GDP, added more than 2% to economic growth. That’s an encouraging sign for the US consumer, who’s facing ongoing pressure from inflation.
Market Wrap: Hawks Sighted at Jackson Hole
At the end of August, the Kansas City Federal Reserve hosted its annual economic symposium in Jackson Hole Wyoming. Once a secretive affair, the event has become one marked by transformational speeches from policy makers. Ben Bernanke used the venue in 2012 to hint at the start of QE3, which was announced a month later. Janet Yellen opened the door for a review of the Fed’s policy toolkit at a speech in 2016. And Jay Powell regularly altered the course of policy during his many speeches at Jackson Hole, including the unveiling of Flexible Average Inflation Targeting (FAIT) in 2020, and a short, hawkish speech in 2022 that reinforced the Fed’s commitment to controlling inflation.
The opening remarks by new Fed Chair Kevin Warsh aren’t likely to have the same lasting impact as some of his predecessor’s speeches, but his message to markets was clear, nonetheless.
This is what Warsh had to say about the Fed’s dual mandate:
As of now, I believe the labor markets are consistent with full employment. But on the price-stability side of our mandate, the numbers are more concerning.”
And his assessment hasn’t been swayed by recent data, either:
“While this summer’s PCE and CPI readings were better than expected, they do not tell me that underlying trends have meaningfully improved.”
What’s that mean for the Federal Reserve and monetary policy? It means that at the next few policy meetings, interest rate hikes are more likely to be the topic of discussion than interest rate cuts. Though the new chair has eschewed the use of forward guidance as a policy tool, his view on the current situation seems clear:
“Here is my standard: We must be confident that underlying inflation is moving to our objective, clearly and at sufficient speed. Otherwise, we have work to do”
Markets are taking that to mean we’ll get at least one hike – and maybe two – by year end.
Bureau of Economic Analysis: https://www.bea.gov/data/gdp/gross-domestic-product
Bureau of Labor Statistics: https://www.bls.gov/
FactSet Earnings Insight: https://advantage.factset.com/hubfs/Website/Resources Section/Research Desk/Earnings Insight/EarningsInsight_072426.pdf
US Census Bureau: https://www.census.gov/retail/sales.html
Federal Reserve: https://www.federalreserve.gov/
Disclosures:
Content in this material is for general information only and not intended to provide specific advice or recommendations for any individual. All performance referenced is historical and is no guarantee of future results. All indices are unmanaged and may not be invested into directly.
The Standard & Poor’s 500 Index is a capitalization weighted index of 500 stocks designed to measure performance of the broad domestic economy through changes in the aggregate market value of 500 stocks representing all major industries.
The NASDAQ Composite Index measures all NASDAQ domestic and non-U.S. based common stocks listed on The NASDAQ Stock Market. The market value, the last sale price multiplied by total shares outstanding, is calculated throughout the trading day, and is related to the total value of the Index.
The Russell 2000 Index is an unmanaged index generally representative of the 2,000 smallest companies in the Russell 3000 index, which represents approximately 10% of the total market capitalization of the Russell 3000 Index.
The Bloomberg U.S. Aggregate Bond Index is an index of the U.S. investment-grade fixed-rate bond market, including both government and corporate bonds.
The MSCI ACWI ex USA Index captures large and mid cap representation across Developed Markets (DM) countries (excluding the US) and Emerging Markets (EM) countries. The index covers approximately 85% of the global equity opportunity set outside the US.