Hormuz Shut… Again: Convergence Commentary - July 2026
Quick Hits
Oil spiked on renewed US-Iran conflict, Hormuz shut again.
Fed held rates; September hike expected.
US stocks dipped; international stocks still leading.
Market-Moving Highlights
The interim peace agreement announced between the US and Iran in mid-June didn’t last long. By mid-July, strikes between the two countries had resumed, and oil tanker traffic through the Strait of Hormuz was shuttered once again.
Prior to the war, about one-fifth of the world’s oil supply flowed through the Strait, and its effective closure has wreaked havoc on energy supply chains. Oil prices are responding in kind. Brent crude – a global benchmark – entered the year near $60 per barrel and rose to more than $110 in the spring. July was nearly as volatile all by itself. Prices tumbled to the low-$70s, then topped $100 as fighting escalated, before ending the month back below $90.
The fast-moving prices may not last forever, but they’re having a meaningful impact on today’s economy and on inflation readings. CPI in June saw its largest monthly drop since 2020, even when excluding the impact of food and energy prices. The July oil price rebound has the potential to reverse some of that progress, if not all.
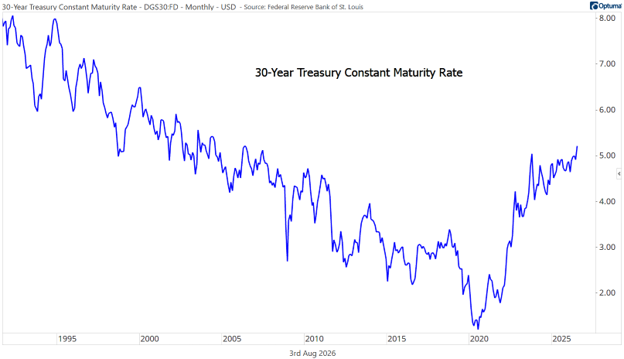
And the uncertainty it creates has made the job of new Fed Chair Kevin Warsh particularly challenging. He and his colleagues chose to keep rates unchanged at their July FOMC meeting, but the consensus seems to be coalescing around a September interest rate hike. Warsh himself is non-committal and continues to eschew any semblance of forward guidance. Markets, however, are pricing in a 0.25% move for next month, and long-dated Treasury rates ended July at the highest level since 2007.
Index Performance
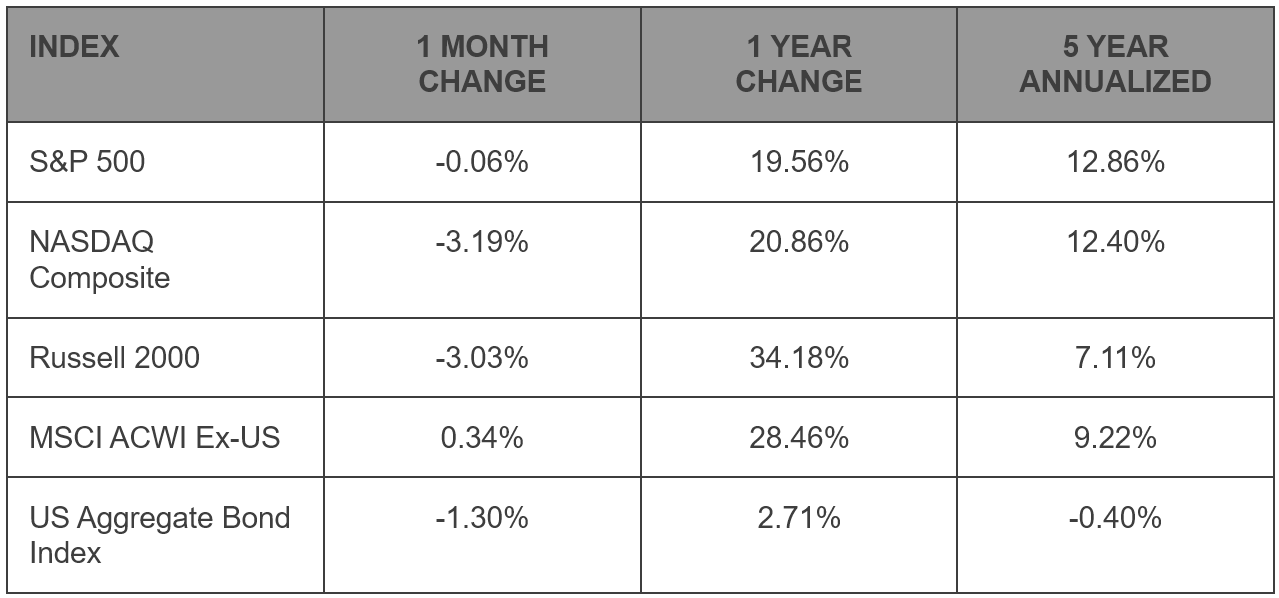
US equity prices fell in July. Large cap growth had another difficult month, as evidenced by the 3.2% decline for the NASDAQ Composite. Small cap stocks also struggled, falling 3.0%. The S&P 500 held up better, closing virtually flat for July, thanks to offsetting strength from value-oriented stocks.
Moving away from US equities, the MSCI ACWI ex-US Index rose modestly in July, and at 14.1%, international stocks are outperforming the S&P 500 and the NASDAQ Composite on a year-to-date basis. If they can hold on to the lead for the next 5 months, that’ll be two consecutive years of superior performance from foreign stocks.
In fixed income, the rise in long-term interest rates pushed bond prices lower. It’s been a choppy year for bonds, but so far in 2026, the US Aggregate Bond Index has generated less negative returns.
S&P 500 Sector Highlights
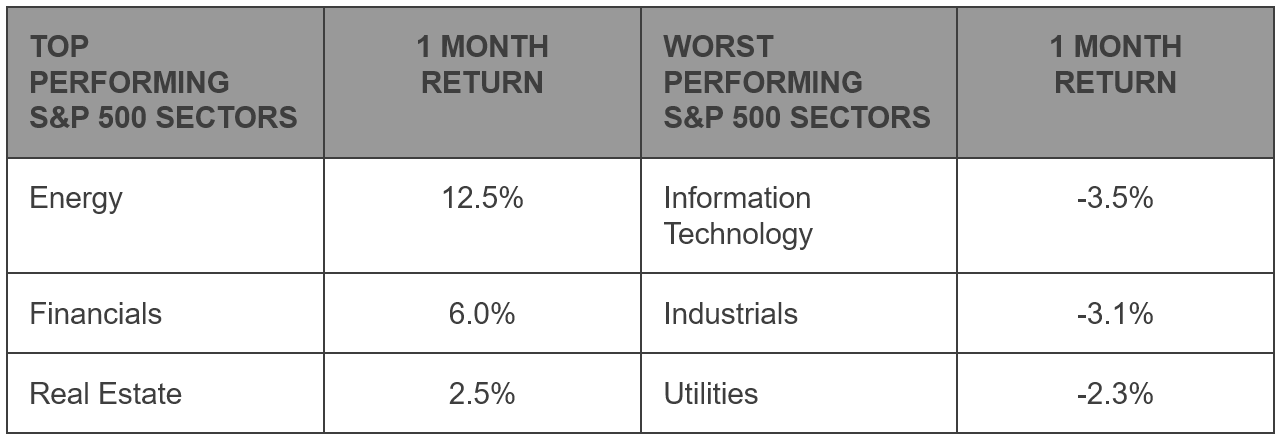
The resumption of hostilities in the Middle East and the surge in oil prices led to a strong month for Energy sector stocks. The group rose 12.5% in July, bringing their year-to-date total to an index-leading 33%. The Financials sector also turned in a solid month after making an appearance on the leaderboard in June, too. The 6% July gain helped push the sector into positive territory for the year.
On the downside, the Information Technology sector dropped 3.5%, as volatility in semiconductor stocks ramped up. The Industrials sector also fell more than 3%. Despite the weak month, those two sectors rank second and third behind Energy on the year-to-date performance scorecard.
What to Watch in August
8/7 - BLS Jobs Report – July
The labor market in June added 57,000 jobs, well below the 113,000 that economists were expecting for the month. Despite the weak payrolls report, the unemployment rate managed to drop from 4.3% to 4.2% during the month, reflecting a sizable drop in the labor force. For July, economists expect to see an 80,000 increase to non-farm payrolls. That would be slightly below the year-to-date average.
8/12 – Consumer Price Inflation - July
Policy makers are struggling to determine whether the spring stoppage of flows through the Strait of Hormuz will prove to be a transitory event for prices, or whether energy costs will lead to more widespread inflationary pressures. CPI in June saw its largest monthly drop since 2020, which surprised many economists who didn’t expect to see price relief until this fall. The July oil price rebound, however, has the potential to reverse some of that progress, if not all.
8/19 – FOMC Minutes - June
The Federal Reserve left interest rates unchanged in June, but three voting members dissented from the decision, preferring instead to raise interest rates. Chair Kevin Warsh has an unusual communication style, in that he doesn’t give much detail or clarity about the Fed’s decision-making process. Given that, the release of meeting minutes could offer important clues about the path of policy.
8/26 – Q2 Gross Domestic Product – Second Estimate
The first estimate of Q2 GDP came in at 1.5%, down modestly from the 1.6% increase in Q1. For now, the US economy appear to be weathering the storm created by war with Iran.
Market Wrap: Focused on The Fed
The current market environment is often compared to the dotcom era of the late 1990s. In at least one way, however, there’s a stark difference. The current market rally is being driven by an expansion of earnings – not just an expectation of potential, future profitability.
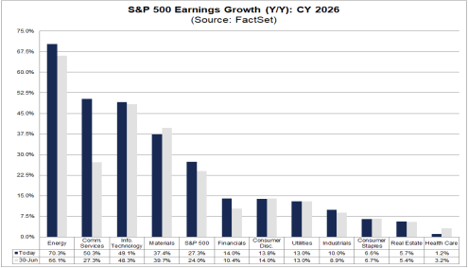
Earnings surged in the first quarter and are accelerating even more in Q2. S&P 500 profits are set to expand nearly 40% from this time last year, led by tremendous gains from Energy, Communication Services, and Information Technology. The rise has been driven by both revenue growth and a nearly unprecedented jump in profit margins.
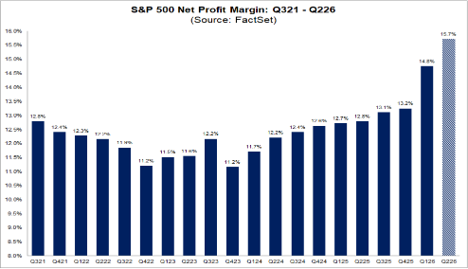
Looking ahead to the second half of 2026, much of the earnings strength is set to continue. Thanks to surging oil prices, earnings estimates for the Energy sector now indicate growth of 70.3% for the year - though in terms of market capitalization, Energy doesn’t have much of an impact on the index these days. Information Technology, however, comprises more than a third of the S&P 500, and tech earnings are expected to rise nearly 50% for the year. That would mark the sector’s best calendar year growth rate in more than 2 decades.
Bureau of Economic Analysis: https://www.bea.gov/data/gdp/gross-domestic-product
Bureau of Labor Statistics: https://www.bls.gov/
US Census Bureau: https://www.census.gov/retail/sales.html
Federal Reserve: https://www.federalreserve.gov/
New York Federal Reserve: https://www.newyorkfed.org/microeconomics/hhdc
Market performance data sourced from Bloomberg Finance L.P. and Optuma
Disclosures:
Content in this material is for general information only and not intended to provide specific advice or recommendations for any individual. All performance referenced is historical and is no guarantee of future results. All indices are unmanaged and may not be invested into directly.
The Standard & Poor’s 500 Index is a capitalization weighted index of 500 stocks designed to measure performance of the broad domestic economy through changes in the aggregate market value of 500 stocks representing all major industries.
The NASDAQ Composite Index measures all NASDAQ domestic and non-U.S. based common stocks listed on The NASDAQ Stock Market. The market value, the last sale price multiplied by total shares outstanding, is calculated throughout the trading day, and is related to the total value of the Index.
The Russell 2000 Index is an unmanaged index generally representative of the 2,000 smallest companies in the Russell 3000 index, which represents approximately 10% of the total market capitalization of the Russell 3000 Index.
The Bloomberg U.S. Aggregate Bond Index is an index of the U.S. investment-grade fixed-rate bond market, including both government and corporate bonds.
The MSCI ACWI ex USA Index captures large and mid cap representation across Developed Markets (DM) countries (excluding the US) and Emerging Markets (EM) countries. The index covers approximately 85% of the global equity opportunity set outside the US.