Oil Falls on Truce: Convergence Commentary - June 2026
Quick Hits
US–Iran truce holds; oil falls below $70.
Fed stays cautious/hawkish as inflation still a concern.
Mixed markets: tech down, small caps and international up.
Market-Moving Highlights
After nearly four months of fighting, the U.S. and Iran announced an interim peace agreement in mid-June, one that would reopen the Strait of Hormuz and pave the way for another 60-days of negotiations. Among other things, the US is still hoping for concessions on Iran’s nuclear program, while Tehran wants to see an end to sanctions on some Iranian assets. In other words, last month’s peace news was a step in the right direction, but it didn’t mark the end of the journey.
That was readily apparent over the following weeks, which included military actions by both countries in spite of the ceasefire agreement. Fortunately, the fragile peace continues to hold.
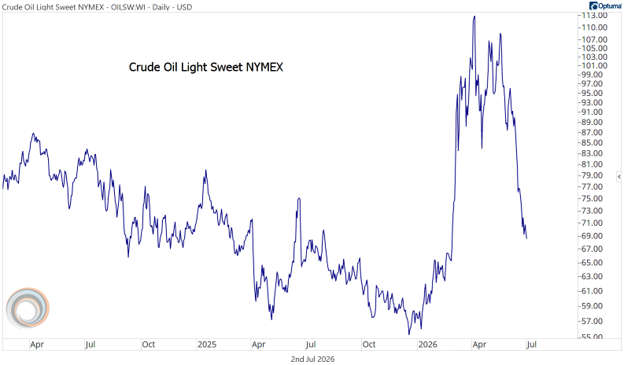
Oil prices have responded in kind. WTI Crude ended June below $70 per barrel, not much higher than it was before the conflict began and a steep discount to where prices were in April and May.
A sustained decline in oil would certainly make the job of the Federal Reserve easier. Kevin Warsh replaced Jerome Powell as Chair in May and headed up his first FOMC meeting last month. Though Warsh in the past had signaled an openness to lowering interest rates, he began his post-meeting press conference by reaffirming the Fed’s commitment to containing inflation and stabilizing prices. And with the other half of the Fed’s dual mandate – full employment – looking well in hand after yet another strong jobs report in the first week of June, Warsh and his colleagues seemed much closer to raising interest rates than cutting them. The oil price reversal, however, may put any policy moves on hold.
Index Performance
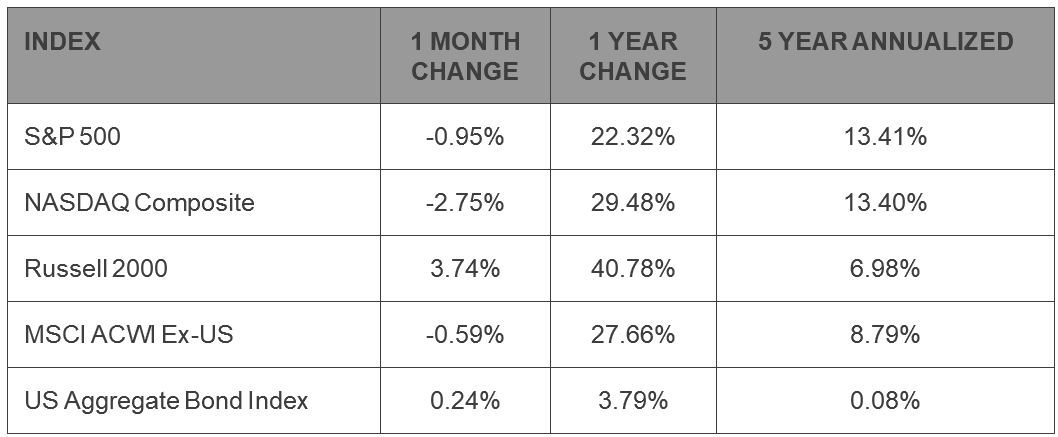
Stock prices were mixed in June. Large cap growth had a difficult month, as evidenced by the 2.8% decline for the NASDAQ Composite. On the flip side, small cap stocks soared: the Russell 2000 index rose 3.7%. The dispersion between large cap and small cap performance is nothing new. Over the past year, the Russell 2000 has climbed a staggering 40%, far outpacing the 22% gains for the large cap S&P 500 Index. Over longer-term timeframes, however, the small caps still have plenty of catching up to do. The 5 year annualized return of the large caps is almost double that of the smalls.
Moving away from US equities, the MSCI ACWI ex-US Index fell modestly in June, but at 13.7%, international stocks are still outperforming the S&P 500 and the NASDAQ Composite on a year-to-date basis.
In fixed income, the 10-year US Treasury yield was largely unchanged for the month. It’s been a choppy year for bonds, but so far in 2026, the US Aggregate Bond Index has generated less than 1% of gains.
S&P 500 Sector Highlights
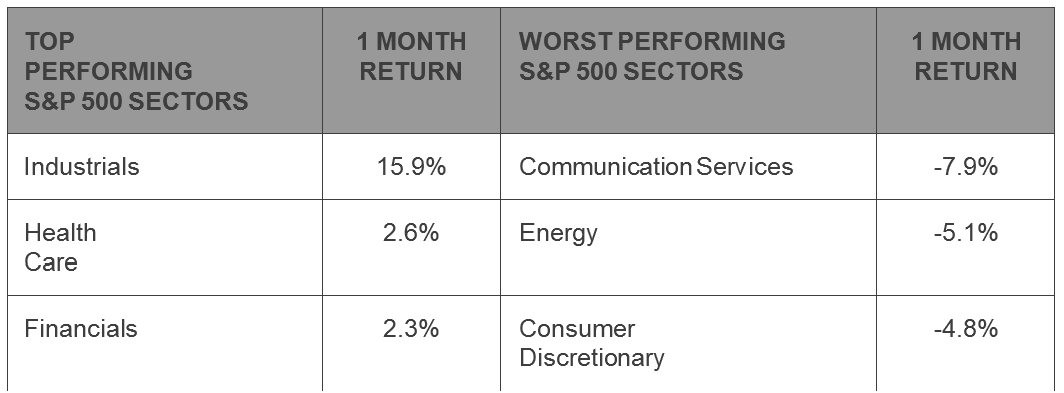
Value stocks returned to the forefront in June after lagging in April and May. After rising 7.2% for the month, the Industrials sector is back at the top of the year-to-date leaderboard, narrowly edging out the Information Technology sector, which dropped 3.3% in June. Health Care stocks, meanwhile, notched their best month of the year.
The Financials sector also turned in a solid June, but even after rising 4.2%, it’s down 2% for the year and is the worst-performing large cap sector in 2026.
On the downside, falling oil prices pushed down Energy stocks by more than 5%. The rest of the losers list was dominated by growth stocks, however. Communication Services, home to names like Alphabet, Meta, and Netflix, dropped nearly 8%. Consumer Discretionary (Amazon, Tesla) fell 4.8%.
What to Watch in July
7/2 - BLS Jobs Report – June
The labor market in June added 57,000 jobs, well below the 113,000 that economists were expecting for the month. The release also included a negative revision of 74,000 to the May release. Despite the weak payrolls report, the unemployment rate managed to drop from 4.3% to 4.2% during the month, reflecting a sizable drop in the labor force. The mixed release points to a labor market that's largely in balance.
7/14 – Consumer Price Inflation - June
CPI rose to 4.2% in May, up from 3.8% in April thanks largely to rising oil prices, which have caused inflation readings to surge. Core CPI, however, came in at just 2.9%. Policy makers are struggling to determine whether the spring stoppage of flows through the Strait of Hormuz will prove to be a transitory event for prices, or whether energy costs will lead to more widespread inflationary pressures. With oil prices staying elevated in the first half of June, economists don’t expect to see much relief on inflation in this month’s report.
7/29 – FOMC Interest Rate Decision
The new, Kevin Warsh-led Fed will meet again to determine the path of interest rate policy. Warsh declined to give much in the way of forward guidance at last week’s meeting, much to the chagrin of many market watchers. Warsh believes that will give more flexibility to the FOMC, allowing them to raise or lower interest rates in response to rapidly changing conditions and without much advance notice. That means anything is on the table in July, though markets today believe a hike is more likely than an interest rate cut.
7/30 – Q2 Gross Domestic Product – First Estimate
The final estimate of Q1 GDP was revised to 2.1% from 1.6%, a healthy increase from the 0.5% growth in Q4 that was dragged lower by the government shutdown. The Q1 number featured larger-than-usual impacts from net exports (e.g. tariffs), but it was likely the ‘cleanest’ measure of GDP that we’ve gotten over the past year. In Q2, we’ll see a clear picture of the magnitude of impacts from war with Iran.
Market Wrap: Bubble Talk
Though the Federal Reserve chose to leave interest rates unchanged in his first meeting as Chair, Kevin Warsh left his mark in the updated - and shortened - press release and again during the post-meeting press conference.
Back in May, Warsh made it clear in a confirmation hearing that he views forward guidance in a negative light. He thinks the Fed’s current practice of providing transparency into how decisions are made and how members are thinking about policy puts limits on members’ ability to react to changing environments.
It wasn’t just talk. The new chair refrained from submitting estimates alongside his colleagues for the quarterly Summary of Economic of Projections. The SEP is a collection of estimates that shows how Fed officials are thinking about economic growth, inflation, the labor market, and the path of interest rates in the coming months. By choosing not to submit estimates of his own, Warsh’s implicitly undermined the release’s credibility.
Furthermore, when answering questions from reporters, he declined to give any details on the path of policy moving forward.
Here’s what Nick Timiraos, Chief Economic Correspondent at the Wall Street Journal, had to say:
There’s a difference between not telling markets your next move and not telling them how you make decisions at all.
Kevin Warsh, at his first meeting as Fed chair, did both.
Warsh got high marks for planting a flag on the Fed’s 2% inflation target and for shearing the policy statement of jargon that had become a recitation of the obvious.
But he also stretched his objection to forward guidance into something broader, using it to sidestep questions about how the committee reasons toward a decision.
Instead of talking about the economy or the path of policy, Warsh spent most of the press conference talking about his plan to establish five independent task forces. These task forces, headed by independent subject matter experts and aided by Fed staffers, are charged with reviewing the Fed’s communications strategy, balance sheet policy, and data collection and usage practices. The final two task forces are aimed at reinforcing the Fed’s dual mandate. One will focus on examining the labor market and the impacts of new technologies on productivity, the other will “examine the drivers of inflation, first principles, and weigh the full range of ideas for delivering price stability in a changing economy.”
One thing’s for sure: Kevin Warsh isn’t afraid to shake things up.
Bureau of Economic Analysis: https://www.bea.gov/data/gdp/gross-domestic-product
Bureau of Labor Statistics: https://www.bls.gov/
US Census Bureau: https://www.census.gov/retail/sales.html
Federal Reserve: https://www.federalreserve.gov/
New York Federal Reserve: https://www.newyorkfed.org/microeconomics/hhdc
Market performance data sourced from Bloomberg Finance L.P. and Optuma
Disclosures:
Content in this material is for general information only and not intended to provide specific advice or recommendations for any individual. All performance referenced is historical and is no guarantee of future results. All indices are unmanaged and may not be invested into directly.
The Standard & Poor’s 500 Index is a capitalization weighted index of 500 stocks designed to measure performance of the broad domestic economy through changes in the aggregate market value of 500 stocks representing all major industries.
The NASDAQ Composite Index measures all NASDAQ domestic and non-U.S. based common stocks listed on The NASDAQ Stock Market. The market value, the last sale price multiplied by total shares outstanding, is calculated throughout the trading day, and is related to the total value of the Index.
The Russell 2000 Index is an unmanaged index generally representative of the 2,000 smallest companies in the Russell 3000 index, which represents approximately 10% of the total market capitalization of the Russell 3000 Index.
The Bloomberg U.S. Aggregate Bond Index is an index of the U.S. investment-grade fixed-rate bond market, including both government and corporate bonds.
The MSCI ACWI ex USA Index captures large and mid cap representation across Developed Markets (DM) countries (excluding the US) and Emerging Markets (EM) countries. The index covers approximately 85% of the global equity opportunity set outside the US.